
Mathematics, 19.11.2020 15:30 silvernekoo
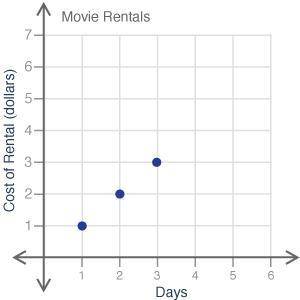
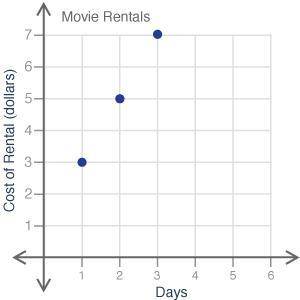
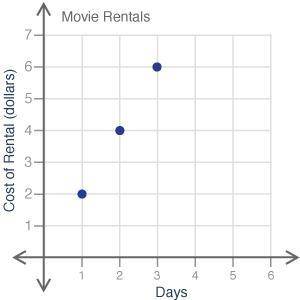
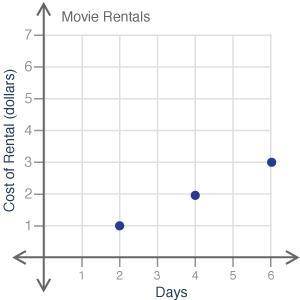
Alex paid $6 for renting a movie for 3 days. Which graph shows the relationship between the costs of renting a movie for different days?

Answers: 2


Another question on Mathematics
Mathematics, 20.06.2019 18:04
Two number cubes are rolled- one blue and one yellow. part a) find the probability that the blue cube is less than 3 and the product is 8. part b) is this event independent or dependent? explain why. your
Answers: 3
Mathematics, 21.06.2019 14:30
Factor. 8x2y2 – 4x2y – 12xy 4(8x2y2 – x – 12xy) 4(2xy – 4x2y – 12xy) 4x2y2(2xy – xy –3) 4xy(2xy – x – 3)
Answers: 2
Mathematics, 21.06.2019 20:00
Evaluate the discriminant of each equation. tell how many solutions each equation has and whether the solutions are real or imaginary. 4x^2 + 20x + 25 = 0
Answers: 2
You know the right answer?
Alex paid $6 for renting a movie for 3 days. Which graph shows the relationship between the costs of...
Questions


Mathematics, 31.01.2020 23:05

English, 31.01.2020 23:05
History, 31.01.2020 23:05

Mathematics, 31.01.2020 23:05
Mathematics, 31.01.2020 23:05


