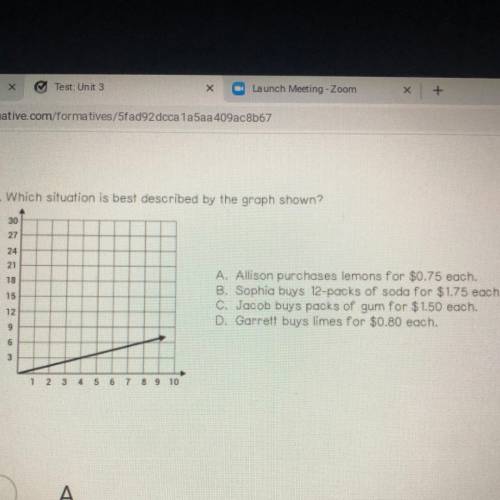
Which situation is best described by the graph shown?
...

Answers: 3


Another question on Mathematics

Mathematics, 21.06.2019 15:10
Which equation represents the partial sum of the geometric series?
Answers: 1
Mathematics, 21.06.2019 21:30
Questions 7-8. use the following table to answer. year 2006 2007 2008 2009 2010 2011 2012 2013 cpi 201.6 207.342 215.303 214.537 218.056 224.939 229.594 232.957 7. suppose you bought a house in 2006 for $120,000. use the table above to calculate the 2013 value adjusted for inflation. (round to the nearest whole number) 8. suppose you bought a house in 2013 for $90,000. use the table above to calculate the 2006 value adjusted for inflation. (round to the nearest whole number)
Answers: 3
Mathematics, 22.06.2019 03:30
Acone is placed inside a cylinder. the cone has half the radius of the cylinder, but the height of each figure is the same. the cone is tilted at an angle so its peak touches the edge of the cylinder’s base. what is the volume of the space remaining in the cylinder after the cone is placed inside it?
Answers: 1
You know the right answer?
Questions
Mathematics, 21.01.2022 06:10

Biology, 21.01.2022 06:10
Mathematics, 21.01.2022 06:10
Mathematics, 21.01.2022 06:10
Mathematics, 21.01.2022 06:10


Mathematics, 21.01.2022 06:10

Health, 21.01.2022 06:10

English, 21.01.2022 06:10

English, 21.01.2022 06:20
Mathematics, 21.01.2022 06:20
History, 21.01.2022 06:20


