Mathematics, 19.11.2020 23:10 twalters88
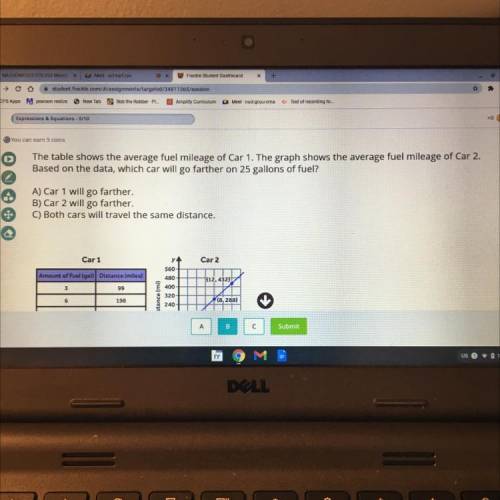
The table shows the average fuel mileage of Car 1. The graph shows the average fuel mileage of Car 2.
Based on the data, which car will go farther on 25 gallons of fuel?
A) Car 1 will go farther.
B) Car 2 will go farther.
C) Both cars will travel the same distance.
Car 1
Car 2
Amount of Fuel (gal) Distance (miles)
у.
560
480
400
320
240
(12, 43211
3
99
6
198
(8,288)
A
B
с
Submit
US
1:49
rr
DOLL


Answers: 1


Another question on Mathematics

Mathematics, 21.06.2019 18:00
If you had $1,900,000, how many days would it take you to spend all if you spent $1 a second. (there are 86,400 seconds in a day)
Answers: 1

Mathematics, 21.06.2019 18:50
The number of fish in a lake can be modeled by the exponential regression equation y=14.08 x 2.08^x where x represents the year
Answers: 3

Mathematics, 21.06.2019 19:30
Consider this equation. |y + 6| = 2 what can be concluded of the equation? check all that apply. there will be one solution. there will be two solutions. the solution to –(y + 6) = 2 will be also be a solution to the given absolute value equation. the solution(s) will be the number(s) on the number line 2 units away from –6. the value of y must be positive since the variable is inside absolute value signs.
Answers: 1

You know the right answer?
The table shows the average fuel mileage of Car 1. The graph shows the average fuel mileage of Car 2...
Questions

SAT, 11.11.2020 04:10


Social Studies, 11.11.2020 04:10


Biology, 11.11.2020 04:10

Mathematics, 11.11.2020 04:10

English, 11.11.2020 04:10


Mathematics, 11.11.2020 04:10

Mathematics, 11.11.2020 04:10

Social Studies, 11.11.2020 04:10


Arts, 11.11.2020 04:10

Health, 11.11.2020 04:10


Chemistry, 11.11.2020 04:20


Mathematics, 11.11.2020 04:20


