
Mathematics, 19.11.2020 23:10 bellad0124outlookcom
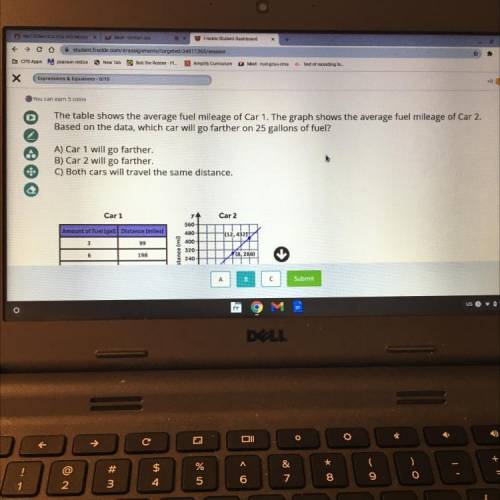
The table shows the average fuel mileage of Car 1. The graph shows the average fuel mileage of Car 2.
Based on the data, which car will go farther on 25 gallons of fuel?
A) Car 1 will go farther.
B) Car 2 will go farther.
C) Both cars will travel the same distance.
Car 1
Car 2
Amount of Fuel (gal) Distance (miles)
у.
560
480
400
320
240
(12, 43211
3
99
6
198
(8,288)
A
B
с
Submit
US
1:49
rr
DOLL

Answers: 2


Another question on Mathematics
Mathematics, 21.06.2019 18:30
Logan wants to know how many skateboards have defective parts. he inspects 20,000 skateboards and keeps track of the number of defects per board. use his probability distribution table to find the expected value for defects on a skateboard.
Answers: 3
Mathematics, 21.06.2019 20:30
The sum of these consecutive integers is equal to 9 less than 4 times the least of the integer. find the three integers
Answers: 1
Mathematics, 22.06.2019 01:00
What is the y-intercept of the line with the equation 3x + 4y = 12?
Answers: 1
You know the right answer?
The table shows the average fuel mileage of Car 1. The graph shows the average fuel mileage of Car 2...
Questions
Mathematics, 22.10.2020 19:01
Mathematics, 22.10.2020 19:01
Mathematics, 22.10.2020 19:01

Spanish, 22.10.2020 19:01

Social Studies, 22.10.2020 19:01


Arts, 22.10.2020 19:01
Mathematics, 22.10.2020 19:01

Mathematics, 22.10.2020 19:01
Mathematics, 22.10.2020 19:01
Mathematics, 22.10.2020 19:01


