
Mathematics, 19.11.2020 23:50 ajaydonlee
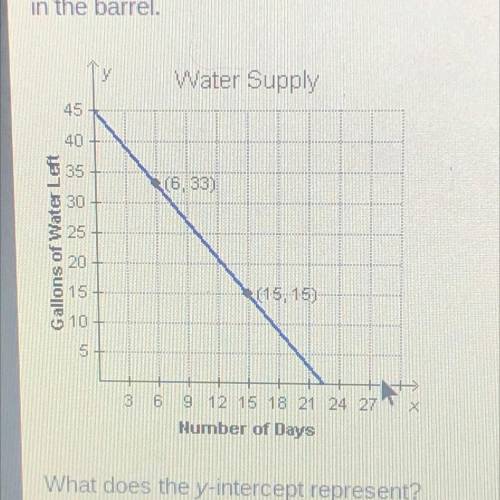
The graph shows the amount of water that remains in a barrel after it begins to leak. The variable x represents the
number of days that have passed since the barrel was filled, and y represents the number of gallons of water that remain in the barrel.
what does the y-intercept represent?
a. the amount of water that is added tot he barrel each day
b. the amount of water that remains in the water barrel
c. the amount of water that is initially in the water barrel
d. the amount that the water barrel decreases each day

Answers: 3


Another question on Mathematics
Mathematics, 21.06.2019 18:30
Identify the polynomial. a2b - cd3 a.monomial b.binomial c.trinomial d.four-term polynomial e.five-term polynomial
Answers: 1
Mathematics, 21.06.2019 23:10
Astudent draws two parabolas on graph paper. both parabolas cross the x-axis at (–4, 0) and (6, 0). the y-intercept of the first parabola is (0, –12). the y-intercept of the second parabola is (0, –24). what is the positive difference between the a values for the two functions that describe the parabolas? write your answer as a decimal rounded to the nearest tenth
Answers: 2
You know the right answer?
The graph shows the amount of water that remains in a barrel after it begins to leak. The variable x...
Questions

Chemistry, 05.11.2019 12:31

Biology, 05.11.2019 12:31

Mathematics, 05.11.2019 12:31

English, 05.11.2019 12:31

Spanish, 05.11.2019 12:31

Arts, 05.11.2019 12:31
Biology, 05.11.2019 12:31
Mathematics, 05.11.2019 12:31

Mathematics, 05.11.2019 12:31
Mathematics, 05.11.2019 12:31
History, 05.11.2019 12:31

Biology, 05.11.2019 12:31

Social Studies, 05.11.2019 12:31
Biology, 05.11.2019 12:31


