
Mathematics, 20.11.2020 23:50 lailalorinda
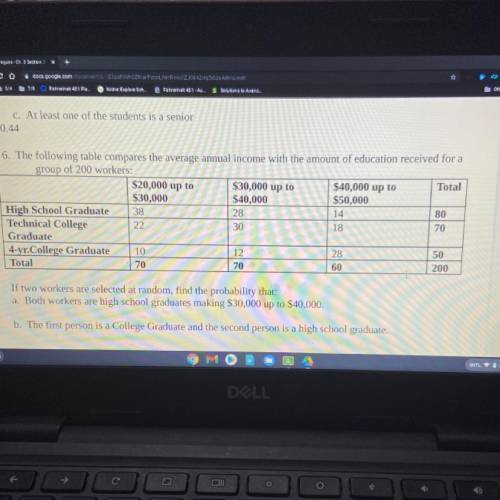
The following table compares the average annual income with amount of education received for a group of 200 workers . If two workers are selected at random find the probability that A. both workers are high school graduates making 30,000 up to $40,000 and B. the first person is a college graduate and a second person is a high school graduate

Answers: 2


Another question on Mathematics
Mathematics, 21.06.2019 20:00
Leslie started last week with $1200 in her checking account. during the week, she wrote the checks below.
Answers: 1
Mathematics, 21.06.2019 21:30
Aye asap pls ! markin da brainiest too ! btw da step choices are all add, distribute, divide, n subtract
Answers: 2
Mathematics, 21.06.2019 23:30
At your job you're paid $50 per week plus $3 per sale at least how many saled do you need to make in order to have over $250
Answers: 1
Mathematics, 21.06.2019 23:30
Consider the sequence below. 3 , 1 , 1/3 , 1/9 , select the explicit function which defines the sequence.
Answers: 1
You know the right answer?
The following table compares the average annual income with amount of education received for a group...
Questions


English, 06.06.2020 02:58
Chemistry, 06.06.2020 02:58


English, 06.06.2020 02:58


