
Mathematics, 21.11.2020 20:10 890777
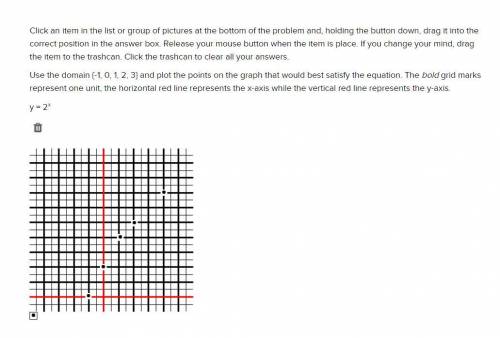
Click an item in the list or group of pictures at the bottom of the problem and, holding the button down, drag it into the correct position in the answer box. Release your mouse button when the item is place. If you change your mind, drag the item to the trashcan. Click the trashcan to clear all your answers.
Use the domain {-1, 0, 1, 2, 3} and plot the points on the graph that would best satisfy the equation. The bold grid marks represent one unit, the horizontal red line represents the x-axis while the vertical red line represents the y-axis.
y = 2x

Answers: 2
 , (0, 1), (1, 2), (2, 4), (3, 8)
 , whatever the power/exponent "x" equals, then y is equal to however many times 2 is multiplied by x.
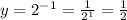


Another question on Mathematics
Mathematics, 21.06.2019 16:30
11. minitab software was used to find the lsrl for a study between x=age and y=days after arthroscopic shoulder surgery until an athlete could return to their sport. use the output to determine the prediction model and correlation between these two variables. predictor coef se coef t p constant -5.054 4.355 -1.16 0.279 age 0.2715 0.1427 1.9 0.094 r-sq = 31.16%
Answers: 2
Mathematics, 21.06.2019 19:20
Which of the following is the result of expanding the series
Answers: 1
Mathematics, 21.06.2019 21:20
The radius of the circle below intersects the unit circle at (3/5,4/5). what is the approximate value of theta? 0.6 radians 1.0 radians 36.9 degrees 53.1 degrees
Answers: 3
Mathematics, 21.06.2019 22:30
Julie was able to walk 16 km through the zoo in 6 hours. how long will it take her to walk 24 km through the zoo?
Answers: 2
You know the right answer?
Click an item in the list or group of pictures at the bottom of the problem and, holding the button...
Questions

History, 06.11.2020 06:40


History, 06.11.2020 06:40

Computers and Technology, 06.11.2020 06:40
Mathematics, 06.11.2020 06:40
Mathematics, 06.11.2020 06:40
Mathematics, 06.11.2020 06:40

Advanced Placement (AP), 06.11.2020 06:40
Mathematics, 06.11.2020 06:40
Mathematics, 06.11.2020 06:40
English, 06.11.2020 06:40
Mathematics, 06.11.2020 06:40


