The
The table shows the average daily number of hours sleep of 10 children.
Age (years)
...

Mathematics, 22.11.2020 01:00 isabellatagaban
The
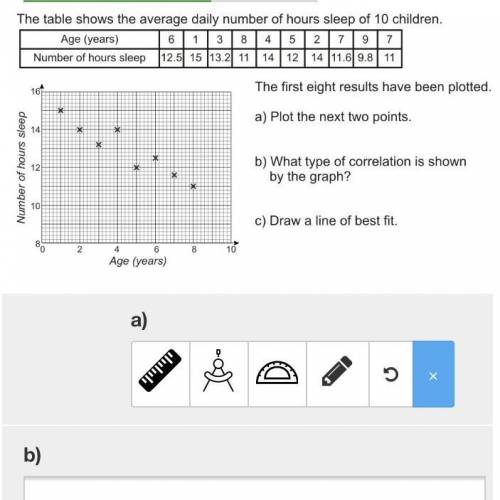
The table shows the average daily number of hours sleep of 10 children.
Age (years)
6 1 3 8 4 5 2 7 9 7
Number of hours sleep 12.5 15 13.2 11 14 12 14 11.69.8 11
The first eight results have been plotted.
a) Plot the next two points.
x
Number of hours sleep
b) What type of correlation is shown
by the graph? Negative
10
c) Draw a line of best fit.
2
4
6
8
10
Age (years)
Please help.

Answers: 1


Another question on Mathematics
Mathematics, 21.06.2019 16:00
Write the expression as a constant , a single trigonometric function, or a power of a trigonometric function. sin x cos x/ tan x
Answers: 1
Mathematics, 21.06.2019 17:00
Abe is a triangle. can you use the sss postulate or the sas postulate to prove triangle abc = triangle aed? by sss only neither apply both apply by sas only
Answers: 2
Mathematics, 21.06.2019 23:30
Plzzz answer both questions and i will give you 100 points
Answers: 1
You know the right answer?
Questions

English, 03.07.2021 01:40
Mathematics, 03.07.2021 01:40
Mathematics, 03.07.2021 01:40


Social Studies, 03.07.2021 01:50

Computers and Technology, 03.07.2021 01:50


