
Mathematics, 22.11.2020 23:40 ramondoss249
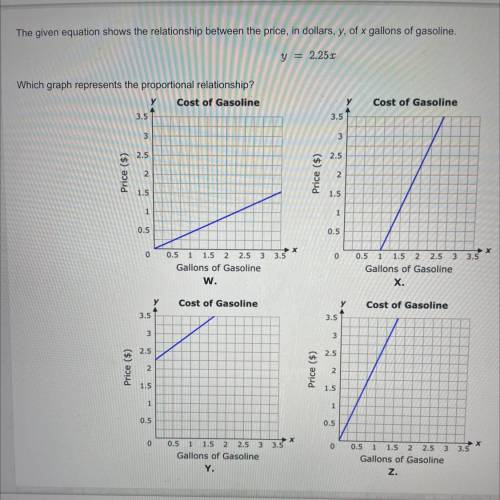
The given equation shows the relationship between the price, in dollars, y, of x gallons of gasoline.
y = 2.251
Which graph represents the proportional relationship?
Cost of Gasoline
3.5
Cost of Gasoline
3.5
3
3
2.5
2.5
Price ($)
2
Price ($)
2
1.5
1.5
1
1
0.5
0.5
0
0
0.5 1 1.5 2 2.5 3 3.5
Gallons of Gasoline
w.
0.5 1 1.5 2 2.5 3 3.5
Gallons of Gasoline
X.
Cost of Gasoline
Cost of Gasoline
Y
3.5
3.5
3
3
2.5
2.5
Price ($)
2
Price ($)
2
1.5
1.5
1
1
0.5
0.5
0
0
0.5 1 1.5 2 2.5
1.5 2 2.5 3 3.5
Gallons of Gasoline
Y.
0.5 1 1.5 2
1.5 2 2.5 3 3.5
Gallons of Gasoline
z.
1 of 10 Answered
Session Score: 0% (0/1)

Answers: 1


Another question on Mathematics
Mathematics, 21.06.2019 17:30
Which of the following is correct interpretation of the expression -4+13
Answers: 2
Mathematics, 21.06.2019 23:30
Consider the sequence below. 3 , 1 , 1/3 , 1/9 , select the explicit function which defines the sequence.
Answers: 1
Mathematics, 22.06.2019 00:30
Simplify the given expression leaving the answer in improper fraction form. 2/3+5/6
Answers: 2
You know the right answer?
The given equation shows the relationship between the price, in dollars, y, of x gallons of gasoline...
Questions
Mathematics, 14.10.2020 16:01

Mathematics, 14.10.2020 16:01

Mathematics, 14.10.2020 16:01


Social Studies, 14.10.2020 16:01

World Languages, 14.10.2020 16:01
Mathematics, 14.10.2020 16:01
Mathematics, 14.10.2020 16:01


Physics, 14.10.2020 16:01
Mathematics, 14.10.2020 16:01
Business, 14.10.2020 16:01
Mathematics, 14.10.2020 16:01


