
Mathematics, 23.11.2020 19:50 aly3048
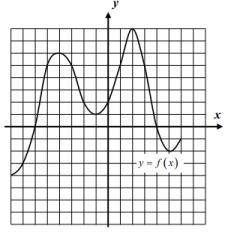
Using the graph of the function f(x) shown below, answer the following questions.
(a) Find f(1).
(b) How many values of x solve the equation
f(x) = 5? Illustrate your answer on the
graph.
(c) What is the y-intercept of this relation?
(d) What are the zeroes of this relation?
Circle the points on your graph.
(e) Give the interval over which f(x) is positive. What is a quick way of seeing this visually?
(f) Give the coordinates of all the maximums and minimums for the relation.
Maximums: _
Minimums: _
(g) State one interval where the function is decreasing and increasing.
Decreasing: _
Increasing: _

Answers: 2


Another question on Mathematics
Mathematics, 21.06.2019 15:00
Adifferent website gives the cost for the first train as £56.88 and the second train as £20.11 with a £9.50 charge for cycle storage for the whole trip. how much would the journey cost you?
Answers: 2
Mathematics, 21.06.2019 16:50
The parabola opens: y=√x-4 (principal square root) up down right left
Answers: 1
Mathematics, 21.06.2019 18:20
Match each inequality to the number line that represents its solution
Answers: 3
Mathematics, 21.06.2019 19:00
Find the y-intercept and x-intercept for the equation 5x-3y=60 what is the y-intercept
Answers: 1
You know the right answer?
Using the graph of the function f(x) shown below, answer the following questions.
(a) Find f(1).
Questions

Computers and Technology, 04.12.2019 03:31
Computers and Technology, 04.12.2019 03:31


Mathematics, 04.12.2019 03:31


