
Mathematics, 23.11.2020 20:00 sksksksksk1
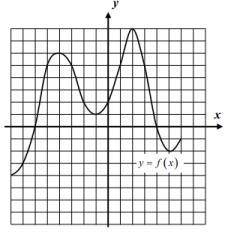
Using the graph of the function f(x) shown below, answer the following questions.
(a) Find f(1).
(b) How many values of x solve the equation
f(x) = 5? Illustrate your answer on the
graph.
(c) What is the y-intercept of this relation?
(d) What are the zeroes of this relation?
Circle the points on your graph.
(e) Give the interval over which f(x) is positive. What is a quick way of seeing this visually?
(f) Give the coordinates of all the maximums and minimums for the relation.

Answers: 2


Another question on Mathematics
Mathematics, 21.06.2019 22:30
Which of the following graphs could represent a quartic function?
Answers: 1
Mathematics, 22.06.2019 03:20
Atotal of 505 tickets were sold for a school play they were either adult tickets or student tickets they were 55 more student tickets so than adult tickets how many adult tickets were sold ?
Answers: 2
Mathematics, 22.06.2019 03:40
Vikram is studying the square pyramid below. on st to find the surface area of the pyramid, in square inches, vikram wrote (33.2) (34 ikram wrote (33.2)(34.2)+43(34.2)(284) what error did vikram make? o he used the same expression for the area of all four lateral faces. he used the wrong expression to represent the area of the base of the pyramid. o he used the wrong value as the height when he found the area of the lateral faces. he used an expression for surface area that only finds the total area of three faces.
Answers: 3
You know the right answer?
Using the graph of the function f(x) shown below, answer the following questions.
(a) Find f(1).
Questions

Law, 15.08.2021 01:00

Mathematics, 15.08.2021 01:00

Mathematics, 15.08.2021 01:00
Mathematics, 15.08.2021 01:00
Mathematics, 15.08.2021 01:00

Computers and Technology, 15.08.2021 01:00

English, 15.08.2021 01:00


History, 15.08.2021 01:00
Mathematics, 15.08.2021 01:00
Chemistry, 15.08.2021 01:00

Mathematics, 15.08.2021 01:00


