
Mathematics, 24.11.2020 01:40 alex281485
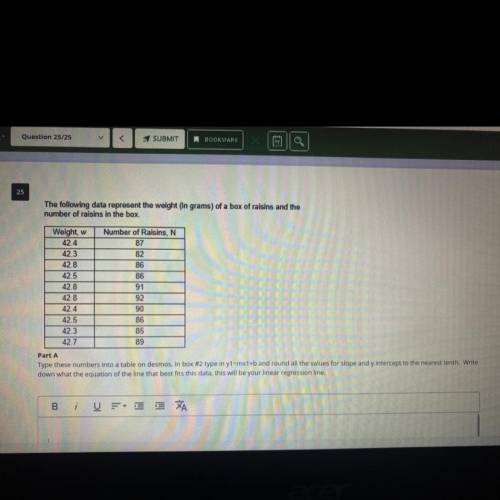
Part A Type these numbers into a table on desmos. In box #2 type in y1-mx1+b and round all the values for slope and y intercept to the nearest tenth. Write down what the equation of the line that best fits this data, this will be your linear regression line.

Answers: 2


Another question on Mathematics
Mathematics, 21.06.2019 20:50
The cost of turkey is directly proportional to its weight. if a 12-pount turkey costs $27, how much does a 16-pound turkey cost? a. $33.75 b. $36.00 c. $31.00 d. $32.50
Answers: 3
Mathematics, 22.06.2019 00:30
Which equation could represent the relationship shown in the scatter plot? y=−3x−2 y=−3/4x+10 y=−2/3x+1 y=9x−12 scatter plot with x axis labeled variable x and y axis labeled variable y. points go from upper left to lower right.
Answers: 1
Mathematics, 22.06.2019 06:30
Mr. alison drives in city traffic to the gas station. he also shops for bread and milk at the gas station. after filling up his car, he drives home on the highway
Answers: 1
You know the right answer?
Part A
Type these numbers into a table on desmos. In box #2 type in y1-mx1+b and round all the valu...
Questions


Mathematics, 14.07.2019 19:00

Computers and Technology, 14.07.2019 19:00
English, 14.07.2019 19:00
English, 14.07.2019 19:00
Mathematics, 14.07.2019 19:00


