
Mathematics, 24.11.2020 22:10 jasminbeganovic141
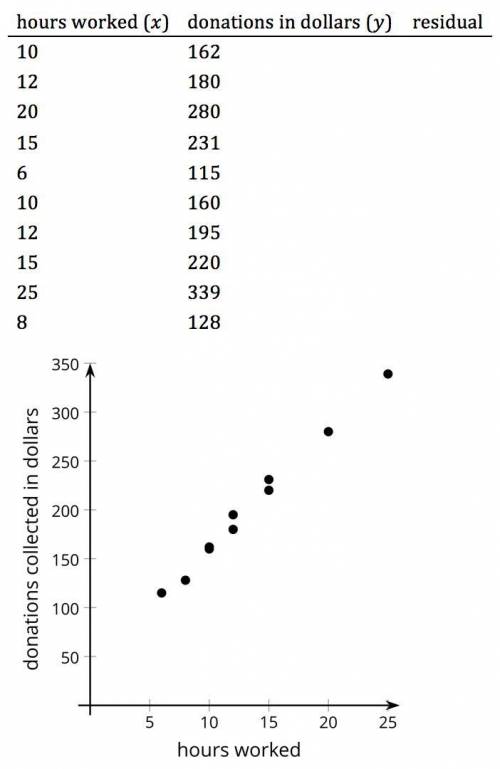
One part of Clare’s job at an environmental awareness organization is to answer the phone to collect donations. The table shows the number of hours she worked each week, x, and the amount of donations in dollars, y, that the organization collected each week for 10 weeks. The data in the scatter plot suggest a linear association. A line to model the data is given by y=12x+41. Clare’s boss sees the graph and tells her, “We certainly tend to bring in a lot more money when you’re working here! This graph proves you’re the cause of this increase in donations!” Do you agree with Clare’s boss? Explain your reasoning.

Answers: 3


Another question on Mathematics
Mathematics, 21.06.2019 18:00
In a graph with several intervals o data how does a constant interval appear? what type of scenario produces a constant interval?
Answers: 1
Mathematics, 21.06.2019 19:20
1- what do you think the product of a nonzero rational number and an irrational number is? is it rational or irrational? make use of variables, the closure property of integers, and possibly a proof by contradiction to prove your hypothesis.2- why do we have to specify that the rational number must be nonzero when we determine what the product of a nonzero rational number and an irrational number is? if the rational number were 0, would it give us the same result we found in the first question?
Answers: 2
Mathematics, 21.06.2019 21:10
If f(x) = 6x – 4, what is f(x) when x = 8? a2 b16 c44 d52
Answers: 2
You know the right answer?
One part of Clare’s job at an environmental awareness organization is to answer the phone to collect...
Questions

Advanced Placement (AP), 13.12.2021 08:40

Health, 13.12.2021 08:40


Mathematics, 13.12.2021 08:40
Mathematics, 13.12.2021 08:40
English, 13.12.2021 08:40
Mathematics, 13.12.2021 08:40
Mathematics, 13.12.2021 08:40
Chemistry, 13.12.2021 08:40

Mathematics, 13.12.2021 08:40

Social Studies, 13.12.2021 08:40
Mathematics, 13.12.2021 08:40
Chemistry, 13.12.2021 08:40

Biology, 13.12.2021 08:40


