Mathematics, 25.11.2020 22:30 krojas015
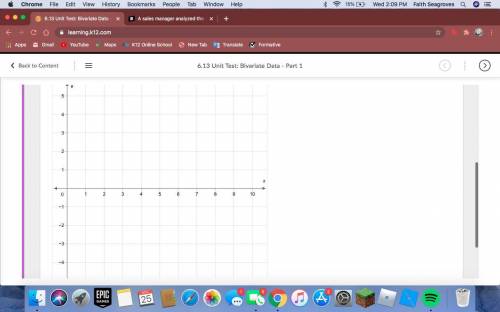
Hese are some of the values in Cole’s data set.
(1, 72), (3,66), (5, 53), (7, 40), (9, 34)
Cole determined the equation of a linear regression line, and determined that these are the corresponding predicted values.
(1, 74), (3,63), (5, 52), (7, 41), (9, 30)
Use the point tool to graph the residual plot for the given values in the data set.


Answers: 1


Another question on Mathematics

Mathematics, 21.06.2019 15:30
Look at the following graph of the given equation. determine whether the equation is a function. explain why or why not.
Answers: 1

Mathematics, 21.06.2019 18:30
Florence price's brownies and more sells all types of cookies and pastries. on tuesdays, they markdown all brownies 75% to a sale of $1.50 a dozen. find the selling price and the markdown of a dozen brownies.
Answers: 1

Mathematics, 21.06.2019 19:40
The weights of broilers (commercially raised chickens) are approximately normally distributed with mean 1387 grams and standard deviation 161 grams. what is the probability that a randomly selected broiler weighs more than 1,425 grams?
Answers: 2

Mathematics, 21.06.2019 20:30
Write the summation to estimate the area under the curve y = 1 + x2 from x = -1 to x = 2 using 3 rectangles and right endpoints
Answers: 1
You know the right answer?
Hese are some of the values in Cole’s data set.
(1, 72), (3,66), (5, 53), (7, 40), (9, 34)
Questions

Chemistry, 02.03.2021 23:50

Mathematics, 02.03.2021 23:50

Spanish, 02.03.2021 23:50

Mathematics, 02.03.2021 23:50


Mathematics, 02.03.2021 23:50

Arts, 02.03.2021 23:50

Mathematics, 03.03.2021 01:00


Mathematics, 03.03.2021 01:00


Mathematics, 03.03.2021 01:00

Mathematics, 03.03.2021 01:00


Mathematics, 03.03.2021 01:00

Social Studies, 03.03.2021 01:00


Mathematics, 03.03.2021 01:00


