HELP ME
Which of the three following graphs display the same data?
County Voter Turnout
...

Mathematics, 27.11.2020 14:00 michelemosbahiow6yya
HELP ME
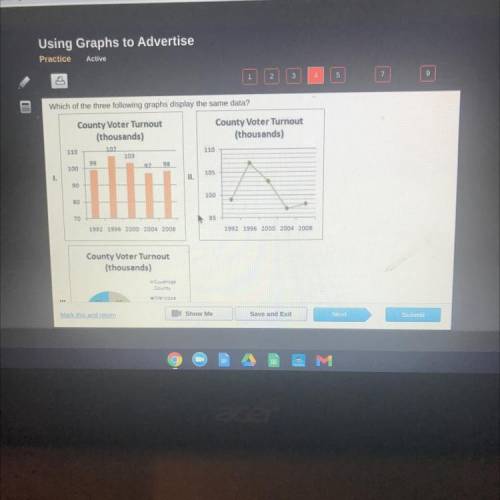
Which of the three following graphs display the same data?
County Voter Turnout
(thousands)
County Voter Turnout
(thousands)
110
107
110
103
99
100
97
98
105
1.
II.
90
100
80
70
95
1992 1996 2000 2004 2008
1992 1996 2000 2004 2008
County Voter Turnout
(thousands)
Cuvanog
County

Answers: 2


Another question on Mathematics
Mathematics, 21.06.2019 19:00
Aplot of land has been surveyed for a new housing development with borders ab, bc, dc, and da. the plot of land is a right trapezoid with a height of 60 feet and an opposite leg length of 65 feet
Answers: 1
Mathematics, 21.06.2019 22:30
Nicole is making carrot bread she needs 5 cups of carrots for 2 cups of sugar.what is the ratio of cups of sugar to cups of carrots that nicole will need? write the ration in three different ways
Answers: 1
Mathematics, 21.06.2019 23:10
Consider the following function. which of the following graphs corresponds to the given function? w. x. y. z. a. z b. y c. x d.
Answers: 1
Mathematics, 21.06.2019 23:20
Which shows a reasonable estimation for 124% of 42 using the distributive property?
Answers: 1
You know the right answer?
Questions
Mathematics, 24.03.2020 17:46

Mathematics, 24.03.2020 17:47

History, 24.03.2020 17:47
Mathematics, 24.03.2020 17:47


