
Mathematics, 29.11.2020 05:20 uwunuzzles
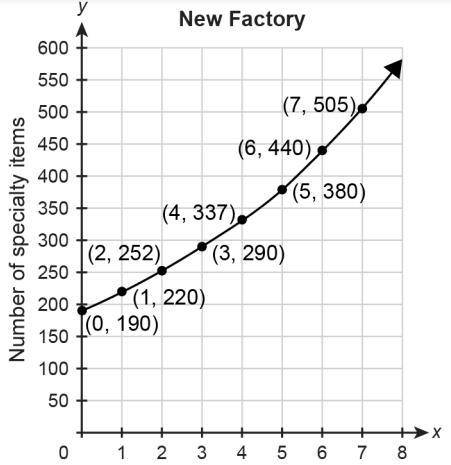
3. The function represents the number of specialty items produced at the old factory w weeks after a change in management. The graph represents the number of specialty items produced at the new factory during the same time period.
(a) During Week 0, how many more specialty items were produced at the old factory than at the new factory? Explain.
(b) Find and compare the growth rates in the weekly number of specialty items produced at each factory. Show your work.
(c) When does the weekly number of specialty items produced at the new factory exceed the weekly number of specialty items produced at the old factory? Explain.

Answers: 3


Another question on Mathematics
Mathematics, 21.06.2019 14:40
What signals you that factoring by grouping is the best method to use when factoring a problem?
Answers: 2
Mathematics, 21.06.2019 18:00
How much dextrose 70% must be mixed with dextrose 5% to prepare 1,000 ml of dextrose 20%?
Answers: 1
Mathematics, 21.06.2019 19:30
Suzanne began a trip with 18 1/2 gallons of gas in the gas tank of her car if she hughes 17 3/4 gallons on the trip how many gallons does she have left once she finish the trip
Answers: 1
Mathematics, 21.06.2019 21:30
The owner of the plant nursery where you were tells you to fill 350 ml bottles from a 30 l from a fertilizer
Answers: 1
You know the right answer?
3. The function represents the number of specialty items produced at the old factory w weeks after a...
Questions
Mathematics, 07.04.2021 20:50
Mathematics, 07.04.2021 20:50


Mathematics, 07.04.2021 20:50

English, 07.04.2021 20:50

History, 07.04.2021 20:50

Arts, 07.04.2021 20:50

English, 07.04.2021 20:50


