
Mathematics, 30.11.2020 01:50 brittanylrodgers99
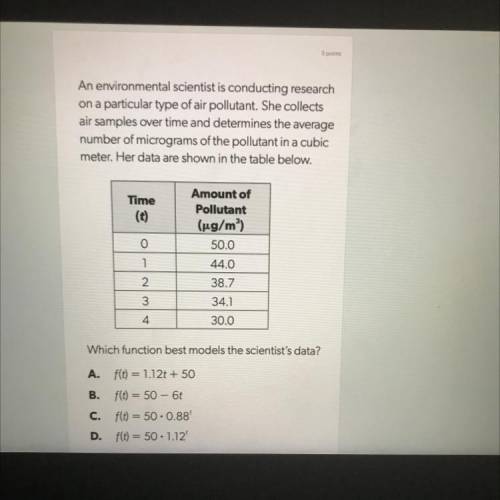
An environmental scientist is conducting research on a particular type of air pollution. She collects air samples over time and determines the average number of micrograms of the pollution in a cubic meter. Her data are shown in the table below.

Answers: 2


Another question on Mathematics
Mathematics, 21.06.2019 21:00
These box plots show the number of electoral votes one by democratic and republican presidential candidates for the elections from 1984 through 2012. which statement best compares the spread of the data sets
Answers: 2
Mathematics, 21.06.2019 23:30
Graph the line with the given slope m and y-intercept b. m=-3,b=1
Answers: 1
Mathematics, 22.06.2019 00:30
Which equation could represent the relationship shown in the scatter plot? y=−3x−2 y=−3/4x+10 y=−2/3x+1 y=9x−12 scatter plot with x axis labeled variable x and y axis labeled variable y. points go from upper left to lower right.
Answers: 1
You know the right answer?
An environmental scientist is conducting research on a particular type of air pollution. She collect...
Questions

History, 05.12.2020 02:40

Spanish, 05.12.2020 02:40
History, 05.12.2020 02:40
Mathematics, 05.12.2020 02:40


Mathematics, 05.12.2020 02:40
Mathematics, 05.12.2020 02:40
Mathematics, 05.12.2020 02:40
Mathematics, 05.12.2020 02:40
Mathematics, 05.12.2020 02:40
Chemistry, 05.12.2020 02:40


