
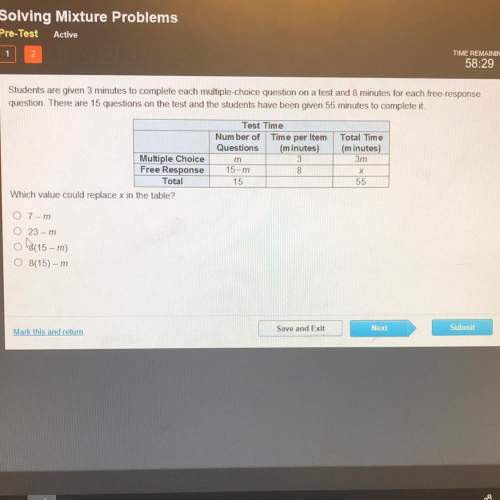
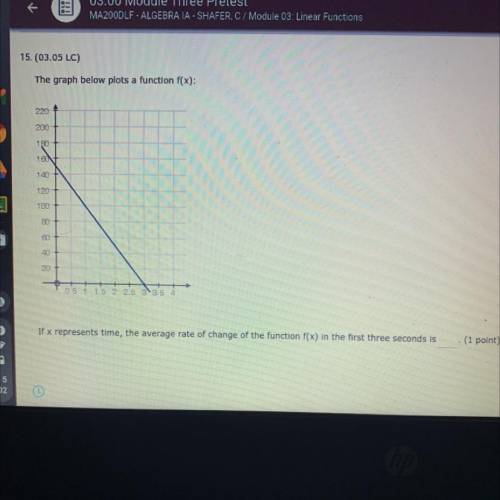
The graph below plots a function f(x):
220
200
190
101
140
120
...

Mathematics, 30.11.2020 03:20 Aidanme25
The graph below plots a function f(x):
220
200
190
101
140
120
100
80
40
20
+
0.5 1 1.5 2 2.5 3 3.5 4
If x represents time, the average rate of change of the function f(x) in the first three seconds is

Answers: 2


Another question on Mathematics
Mathematics, 21.06.2019 21:10
What is the equation of a line passing through (-6,5) and having a slope of 1/3
Answers: 3
Mathematics, 22.06.2019 03:00
In the triangle rst, rs = 65 and st = 60. which equation could be used to find the value of angle s?
Answers: 2
Mathematics, 22.06.2019 03:30
Which of the following is true about the following construction of a tangent to a circle from a point outside of the circle?
Answers: 2
Mathematics, 22.06.2019 04:20
What is the difference between a linear interval and a nonlinear interval?
Answers: 1
You know the right answer?
Questions

English, 03.05.2021 04:50
Mathematics, 03.05.2021 04:50
Mathematics, 03.05.2021 04:50


Chemistry, 03.05.2021 04:50
Mathematics, 03.05.2021 04:50
Physics, 03.05.2021 04:50
Mathematics, 03.05.2021 04:50
Mathematics, 03.05.2021 04:50
Mathematics, 03.05.2021 04:50
Mathematics, 03.05.2021 04:50


