01:47:
How does the graph of g(x) =
X+4
- 6
compare to the graph of the parent fu...

Mathematics, 30.11.2020 03:50 Rakeem458
01:47:
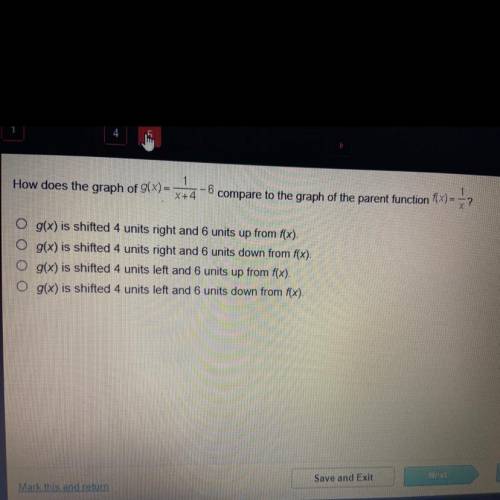
How does the graph of g(x) =
X+4
- 6
compare to the graph of the parent function f(x) =
= 12
g(x) is shifted 4 units right and 6 units up from f(x).
g(x) is shifted 4 units right and 6 units down from f(x).
g(x) is shifted 4 units left and 6 units up from f(x).
O g(x) is shifted 4 units left and 6 units down from f(x).
Mark this and return
Save and Exit

Answers: 2


Another question on Mathematics
Mathematics, 21.06.2019 19:30
Two variables, x and y, vary inversely, and x=12 when y=4. what is the value of y when x=3?
Answers: 1
Mathematics, 21.06.2019 20:10
Look at the hyperbola graphed below. the hyperbola gets very close to the red lines on the graph, but it never touches them. which term describes each of the red lines? o o o o a. asymptote b. directrix c. focus d. axis
Answers: 3
You know the right answer?
Questions

Mathematics, 19.01.2021 18:20

History, 19.01.2021 18:20
Mathematics, 19.01.2021 18:20

Social Studies, 19.01.2021 18:20

Law, 19.01.2021 18:20

English, 19.01.2021 18:20
Mathematics, 19.01.2021 18:20
Mathematics, 19.01.2021 18:20

Computers and Technology, 19.01.2021 18:20
Mathematics, 19.01.2021 18:20


