
Mathematics, 30.11.2020 22:10 bedsaul12345
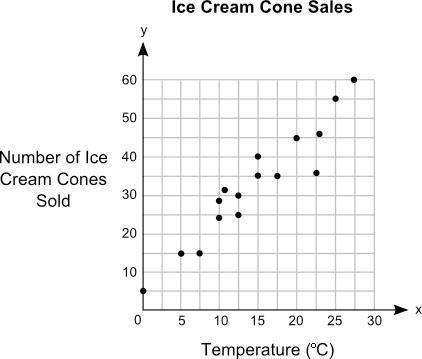
Which graph shows a negative correlation? A graph with both axes unnumbered. Points show a steady trend. A graph with both axes unnumbered. Points are scattered loosely in the top half of the graph. A graph with both axes unnumbered. Points show a downward trend. A graph with both axes unnumbered. Points are scattered loosely all Over graph.

Answers: 3


Another question on Mathematics
Mathematics, 21.06.2019 16:00
Enter the number of complex zeros for the polynomial function in the box. f(x) = x+ + 5x² +6
Answers: 2
Mathematics, 21.06.2019 18:30
If you are trying to move an attached term across the equal sign (=), what operation would you use to move it?
Answers: 2
Mathematics, 21.06.2019 19:30
Look at this pattern ; 1,4,9, number 10000 belongs in this pattern . what’s the place of this number?
Answers: 3
You know the right answer?
Which graph shows a negative correlation? A graph with both axes unnumbered. Points show a steady tr...
Questions

Physics, 16.10.2019 16:50

English, 16.10.2019 16:50

Biology, 16.10.2019 16:50

History, 16.10.2019 16:50
Biology, 16.10.2019 16:50
History, 16.10.2019 16:50
Mathematics, 16.10.2019 16:50
Mathematics, 16.10.2019 16:50
Mathematics, 16.10.2019 16:50
English, 16.10.2019 16:50

Chemistry, 16.10.2019 16:50


