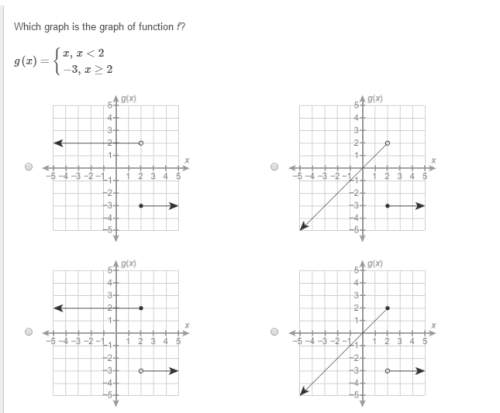
Which graph is the graph of function f?
g(x)={x, x< 2
−3, x≥2
...

Mathematics, 17.09.2019 20:00 ishmael9332
Which graph is the graph of function f?
g(x)={x, x< 2
−3, x≥2

Answers: 1


Another question on Mathematics
Mathematics, 21.06.2019 15:20
The vertices of a rectangle are given in the columns of the matrix . if is found to perform a transformation, what are the coordinates of the transformed rectangle? (0, 0), (0, –3), (–3, –3), (–3, 0) (0, 0), (0, 3), (3, 3), (3, 0) (0, 0), (0, 3), (–3, –3), (–3, 0) (0, 0), (0, 3), (–3, 3), (–3, 0)
Answers: 1
Mathematics, 21.06.2019 19:00
The annual snowfall in a town has a mean of 38 inches and a standard deviation of 10 inches. last year there were 63 inches of snow. find the number of standard deviations from the mean that is, rounded to two decimal places. 0.44 standard deviations below the mean 2.50 standard deviations below the mean 0.44 standard deviations above the mean 2.50 standard deviations above the mean
Answers: 3
Mathematics, 21.06.2019 20:00
In new york city at the spring equinox there are 12 hours 8 minutes of daylight. the longest and shortest days of the year very by two hours and 53 minutes from the equinox in this year the equinox falls on march 21 in this task you use trigonometric function to model the hours of daylight hours on certain days of the year in new york city a.what is the independent and dependent variables? b.find the amplitude and the period of the function. c.create a trigonometric function that describes the hours of sunlight for each day of the year. d. graph the function you build in part c. e. use the function you build in part c to find out how many fewer daylight hours february 10 will have than march 21. you may look at the calendar.
Answers: 1
Mathematics, 21.06.2019 20:30
Asmall business produces and sells balls. the fixed costs are $20 and each ball costs $4.32 to produce. each ball sells for $8.32. write the equations for the total cost, c, and the revenue, r, then use the graphing method to determine how many balls must be sold to break even.
Answers: 1
You know the right answer?
Questions

Mathematics, 17.12.2020 03:40

Social Studies, 17.12.2020 03:40
Mathematics, 17.12.2020 03:40

World Languages, 17.12.2020 03:40

Mathematics, 17.12.2020 03:40

Mathematics, 17.12.2020 03:40
Mathematics, 17.12.2020 03:40

Biology, 17.12.2020 03:40
Biology, 17.12.2020 03:40


Chemistry, 17.12.2020 03:40

Arts, 17.12.2020 03:40
Mathematics, 17.12.2020 03:40

Mathematics, 17.12.2020 03:40


