Understanding a Correlation Coefficient
Data
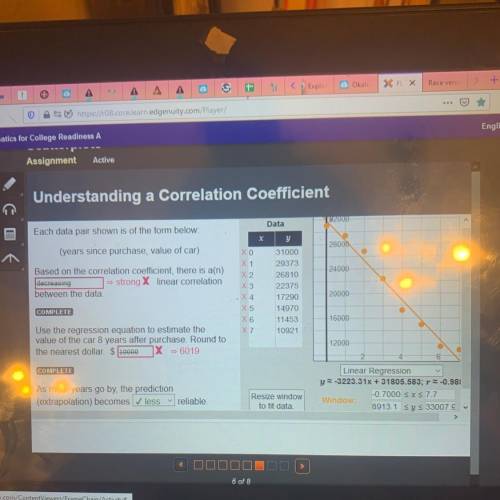
Each data pair shown is of the form below:
...

Mathematics, 02.12.2020 05:40 katelynnjoyce1
Understanding a Correlation Coefficient
Data
Each data pair shown is of the form below:
192000
X
Y
(years since purchase, value of car)
28000
Хо
X1
X2
24000
Based on the correlation coefficient, there is a(n)
decreasing = strong X linear correlation
between the data
X3
. X4
X 5
31000
29373
26810
22375
17290
14970
11453
20000
COMPLETE
X6
16000
X 7
10921
Use the regression equation to estimate the
value of the car 8 years after purchase. Round to
the nearest dollar. $ 10000 X = 6019
12000
COMPLETE
As more years go by, the prediction
(extrapolation) becomes ✓ less
Linear Regression
y-3223.31x + 31805.583; r -0.981
-0.7000 SXS 7.7
Window
8913.1 sy $ 33007..
reliable
Resize window
to fit data.

Answers: 3


Another question on Mathematics
Mathematics, 21.06.2019 13:10
True or false? many triangular shapes can be circumscribed about a given circle
Answers: 2
Mathematics, 21.06.2019 16:40
Which data set has a greater spread? why? set a: {38, 12, 23, 48, 55, 16, 18} set b: {44, 13, 24, 12, 56} has a greater spread because .
Answers: 2
Mathematics, 21.06.2019 17:30
Janet drove 300 miles in 4.5 hours. write an equation to find the rate at which she was traveling
Answers: 2
Mathematics, 21.06.2019 18:00
Assume that the weights of quarters are normally distributed with a mean of 5.67 g and a standard deviation 0.070 g. a vending machine will only accept coins weighing between 5.48 g and 5.82 g. what percentage of legal quarters will be rejected? round your answer to two decimal places.
Answers: 1
You know the right answer?
Questions

Medicine, 27.05.2021 01:00


History, 27.05.2021 01:00
History, 27.05.2021 01:00
English, 27.05.2021 01:00
Mathematics, 27.05.2021 01:00
Mathematics, 27.05.2021 01:00

Chemistry, 27.05.2021 01:00

Mathematics, 27.05.2021 01:00
Mathematics, 27.05.2021 01:00
Mathematics, 27.05.2021 01:00
History, 27.05.2021 01:00
Mathematics, 27.05.2021 01:00
History, 27.05.2021 01:00

Mathematics, 27.05.2021 01:00


