
Mathematics, 02.12.2020 21:10 0055babs
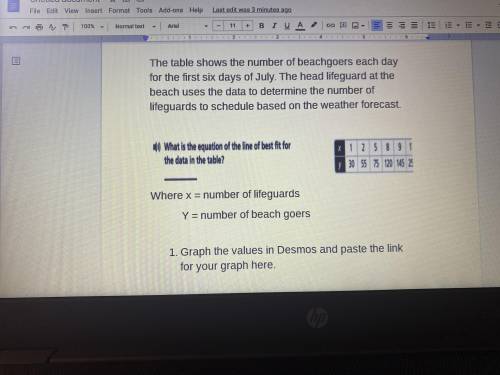
The table shows the number of beachgoers each day for the first six days of July. The head lifeguard at the beach uses the data to determine the number of lifeguards to schedule based on the weather forecast. What the equation of the line of best fit for the data in the table? 30 55 75 Where x = number of lifeguards Y = number of beach goers 1. Graph the values in Desmos and paste the link for your graph here .

Answers: 1


Another question on Mathematics
Mathematics, 21.06.2019 16:50
Rockwell hardness of pins of a certain type is known to have a mean value of 50 and a standard deviation of 1.1. (round your answers to four decimal places.) (a) if the distribution is normal, what is the probability that the sample mean hardness for a random sample of 8 pins is at least 51?
Answers: 3
Mathematics, 21.06.2019 17:00
Acylinder has volume 45π and radius 3. what is it’s height?
Answers: 2
Mathematics, 21.06.2019 20:30
What is always true about a positive integer raised to a negative odd power?
Answers: 1
Mathematics, 21.06.2019 21:50
5. which description does not guarantee that a quadrilateral is a squar ajo is a parallelogram with perpendicular diagonals 0% has all sides congruent and all angles congruent o has all right angles and has all sides congruent 10% is both a rectangle and a rhombus 30%
Answers: 2
You know the right answer?
The table shows the number of beachgoers each day for the first six days of July. The head lifeguard...
Questions
Engineering, 04.08.2020 18:01


Computers and Technology, 04.08.2020 18:01
Social Studies, 04.08.2020 18:01


Chemistry, 04.08.2020 18:01

Physics, 04.08.2020 18:01


