
Mathematics, 03.12.2020 18:40 BaileyRyan8320
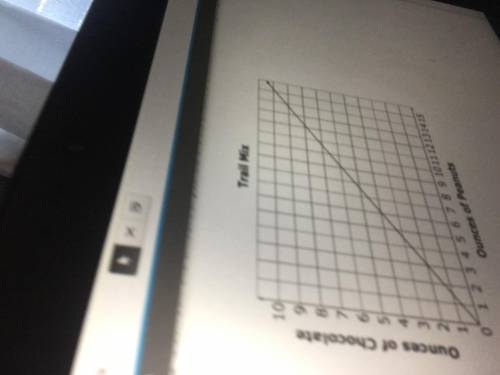
The graph below shows the relationship between the amount of peanuts and the amount of chocolate in different packages of snack mix for each ounce of peanuts? A.1/2 B.2/3 C.3/4 D.3/2 please i need answers

Answers: 2


Another question on Mathematics
Mathematics, 21.06.2019 13:30
Which point is a solution to the inequality shown in this graph (-3,-3)(3,-1)
Answers: 2
Mathematics, 21.06.2019 16:10
Determine whether the following statements are true and give an explanation or counterexample. bold a. when using the shell method, the axis of the cylindrical shells is parallel to the axis of revolution. bold b. if a region is revolved about the y-axis, then the shell method must be used. bold c. if a region is revolved about the x-axis, then in principle it is possible to use the disk/washer method and integrate with respect to x or the shell method and integrate with respect to y.
Answers: 3
Mathematics, 21.06.2019 17:50
F(x) = x2 − 9, and g(x) = x − 3 f(x) = x2 − 4x + 3, and g(x) = x − 3 f(x) = x2 + 4x − 5, and g(x) = x − 1 f(x) = x2 − 16, and g(x) = x − 4 h(x) = x + 5 arrowright h(x) = x + 3 arrowright h(x) = x + 4 arrowright h(x) = x − 1 arrowright
Answers: 2
Mathematics, 21.06.2019 20:30
In an improper fraction, is the numerator equal to, less than, or greater than the denominator
Answers: 2
You know the right answer?
The graph below shows the relationship between the amount of peanuts and the amount of chocolate in...
Questions

History, 23.10.2020 22:50
Mathematics, 23.10.2020 22:50


Mathematics, 23.10.2020 22:50
Mathematics, 23.10.2020 22:50
Mathematics, 23.10.2020 22:50

Mathematics, 23.10.2020 22:50


