
Mathematics, 03.12.2020 20:10 kat1297
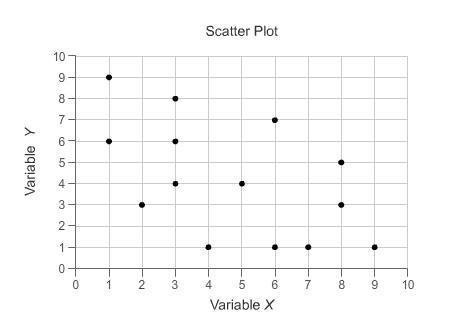
Use the data to make a scatterplot. Then use the scatterplot to estimate a reasonable correlation coefficient.
Х Y
0 2
-1 -1
-4 -3
2 5
3 7
A. 0.97
B. -0.97
C. -0.65
D. 0.18

Answers: 3


Another question on Mathematics
Mathematics, 21.06.2019 19:00
Solving systems of linear equations: tables represent two linear functions in a systemöwhat is the solution to this system? 0 (10)0 (1.6)0 18,26)0 18-22)
Answers: 1
Mathematics, 21.06.2019 20:30
The frequency table shows the results of a survey comparing the number of beach towels sold for full price and at a discount during each of the three summer months. the store owner converts the frequency table to a conditional relative frequency table by row. which value should he use for x? round to the nearest hundredth. 0.89 0.90 0.92 0.96
Answers: 2
You know the right answer?
Use the data to make a scatterplot. Then use the scatterplot to estimate a reasonable correlation co...
Questions

Social Studies, 02.12.2019 05:31

English, 02.12.2019 05:31
Social Studies, 02.12.2019 05:31

Chemistry, 02.12.2019 05:31

Biology, 02.12.2019 05:31


Health, 02.12.2019 05:31
Mathematics, 02.12.2019 05:31
Mathematics, 02.12.2019 05:31
English, 02.12.2019 05:31

Mathematics, 02.12.2019 05:31


