
Mathematics, 03.12.2020 22:20 gabev420
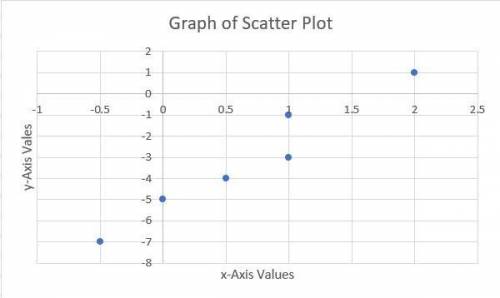
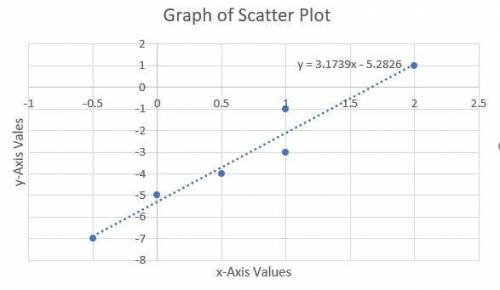
Which equation best models the data shown in the scatter plot?
In the graph of scatter plot, the range of the x axis is minus four to four by increment of one and the range of the y axis is minus seven to one by increment of one. On the x axis minus four, minus two, two, and four are labeled. On the y axis minus six, minus four, and minus two are labeled. On the graph, there are points at (-0.5, -7), (0, -5), (0.5, -4), (1, -3), (1, -1), and (2, 1).
A. y = x − 3
B. y = x − 5
C. y = 3x − 3
D. y = 3x − 5

Answers: 1


Another question on Mathematics
Mathematics, 21.06.2019 18:20
17. a researcher measures three variables, x, y, and z for each individual in a sample of n = 20. the pearson correlations for this sample are rxy = 0.6, rxz = 0.4, and ryz = 0.7. a. find the partial correlation between x and y, holding z constant. b. find the partial correlation between x and z, holding y constant. (hint: simply switch the labels for the variables y and z to correspond with the labels in the equation.) gravetter, frederick j. statistics for the behavioral sciences (p. 526). cengage learning. kindle edition.
Answers: 2
Mathematics, 21.06.2019 22:10
What is the area of the original rectangle? 8 cm² 20 cm² 25 cm² 40 cm²
Answers: 1
Mathematics, 21.06.2019 22:20
Line segment eg is partitioned by point f in the ratio 1: 1. point e is at e (0, 4), and point f is at (1, 3). what are the coordinates of point g? (−1, 5) (2, 2) (3, 1) (4, 0)
Answers: 2
Mathematics, 22.06.2019 01:20
The domain of the following relation: r: {(3, 5), (8, 6), (2, 1), (8, 6)} is (1 point) no domain exists {1, 5, 6} {3, 8, 2, 8} {2, 3, 8}
Answers: 2
You know the right answer?
Which equation best models the data shown in the scatter plot?
In the graph of scatter plot, the ra...
Questions


Biology, 22.07.2019 15:30
Biology, 22.07.2019 15:30
Mathematics, 22.07.2019 15:30
Mathematics, 22.07.2019 15:30
Mathematics, 22.07.2019 15:30

Social Studies, 22.07.2019 15:30
Biology, 22.07.2019 15:30
English, 22.07.2019 15:30

Mathematics, 22.07.2019 15:30
Chemistry, 22.07.2019 15:30

Spanish, 22.07.2019 15:30


