
Mathematics, 03.12.2020 23:30 Gbecky122
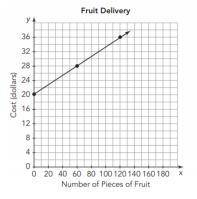
Determine whether the graph represents a proportional or non-proportional relationship. Then select the correct equation in the form y=mx or y=mx+b to represent the relationship between the independent and dependent quantities.
This graph is an example of a blank area relationship. The equation that represents the relationship between the independent and dependent quantities is blank area.
Proportional
Unproportional
y=60x
y=5x+20
y=x+30
Help me fill in the blank I will choose branilest

Answers: 2


Another question on Mathematics
Mathematics, 21.06.2019 20:00
Which of these numbers of simulations of an event would be most likely to produce results that are closest to those predicted by probability theory? 15, 20, 5, 10
Answers: 2
Mathematics, 21.06.2019 22:00
Worth 100 points need the answers asap first row -x^2 2x^2 (x/2)^2 x^2 x is less than 2 x is greater than 2 x is less than or equal to 2 x is greater than or equal to 2 second row -5 -5/2 4 5 •2 is less than x& x is less than 4 •2 is less than or equal to x & x is less than or equal to 4 •2 is less than or equal to x& x is less than 4 •2 is less than x& x is less than or equal to 4
Answers: 2
Mathematics, 21.06.2019 23:10
Consider the following function. which of the following graphs corresponds to the given function? w. x. y. z. a. z b. y c. x d.
Answers: 1
You know the right answer?
Determine whether the graph represents a proportional or non-proportional relationship. Then select...
Questions


Social Studies, 10.12.2020 20:40


Mathematics, 10.12.2020 20:40
Mathematics, 10.12.2020 20:40
English, 10.12.2020 20:40
Physics, 10.12.2020 20:40
Mathematics, 10.12.2020 20:40


