Mathematics, 04.12.2020 19:40 milkshakegrande101
YOU DONT HAVE TO DO ALL IF YOU DONT WANT TO JUST DO WHAT YOU CAN
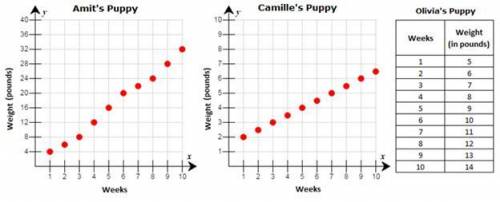
b. Is the relationship for Amit’s puppy’s weight in terms of time linear or nonlinear? Explain your response.
c. Is the relationship for Amit’s puppy’s weight in terms of time increasing or decreasing? Explain your response.
Type your response here:
d. Does the data for Camille’s puppy show a function? Why or why not?
Type your response here:
e. Is the relationship for Camille’s puppy’s weight in terms of time linear or nonlinear? Explain your response.
Type your response here:
f. Is the relationship for Camille’s puppy’s weight in terms of time increasing or decreasing? Explain your response.
Type your response here:
g. Does the data for Olivia’s puppy show a function? Why or why not?
Type your response here:
h. Is the relationship for Olivia’s puppy’s weight in terms of time linear or nonlinear? Explain your response.
Type your response here:
i. Is the relationship for Olivia’s puppy’s weight in terms of time increasing or decreasing? Explain your response.
Type your response here:
j. Which two relationships have a y-intercept and a constant rate of change?
Type your response here:
Task 2: Comparing Functions
In this task, you will use the linear data from task 1 to compare the linear functions.
a. To compare the linear functions, you first need to find their equations. For each of the linear functions, write an equation to represent the puppy’s weight in terms of the number of weeks since the person got the puppy.
Type your response here:
b. Now you can compare the functions. In each equation, what do the slope and y-intercept represent in terms of the situation?
Type your response here:
c. Whose puppy weighed the most when the person got it? How much did it weigh?
Type your response here:
d. Whose puppy gained weight the slowest? How much did it gain per week?
Type your response here:
e. You can also graph the functions to compare them. Using the Edmentum Graphing Tool, graph the two linear functions. Paste a screenshot of the two functions in the space provided.
How could you find which puppy had the greater initial weight from the graph? How could you find which puppy gained weight the slowest?
Type your response here:


Answers: 2


Another question on Mathematics

Mathematics, 21.06.2019 18:00
Sarah used her calculator to find sin 125 degrees. she wrote down sin sin125 degrees.57. how could sarah recognize that her answer is incorrect?
Answers: 1

Mathematics, 21.06.2019 19:40
Neoli is a nurse who works each day from 8: 00 am to 4: 00 pm at the blood collection centre. she takes 45 minutes for her lunch break. on average, it takes neoli 15 minutes to collect each sample and record the patient's details. on average, how many patients can neoli see each day?
Answers: 3

Mathematics, 21.06.2019 20:00
Write the expression as a single natural logarithm. 2 in a - 4 in y
Answers: 1

Mathematics, 21.06.2019 20:00
True or false: the graph of y=f(bx) is a horizontal compression of the graph y=f(x) if b< 1
Answers: 2
You know the right answer?
YOU DONT HAVE TO DO ALL IF YOU DONT WANT TO JUST DO WHAT YOU CAN
b. Is the relationship for Amit’s...
Questions


Mathematics, 24.03.2021 17:40


Mathematics, 24.03.2021 17:40

Biology, 24.03.2021 17:40

Mathematics, 24.03.2021 17:40

English, 24.03.2021 17:40

Mathematics, 24.03.2021 17:40

Biology, 24.03.2021 17:40

English, 24.03.2021 17:40

English, 24.03.2021 17:40

Mathematics, 24.03.2021 17:40


Mathematics, 24.03.2021 17:40

Mathematics, 24.03.2021 17:40

Mathematics, 24.03.2021 17:40


Mathematics, 24.03.2021 17:40


