subject
Mathematics, 04.12.2020 22:30 jeanieb

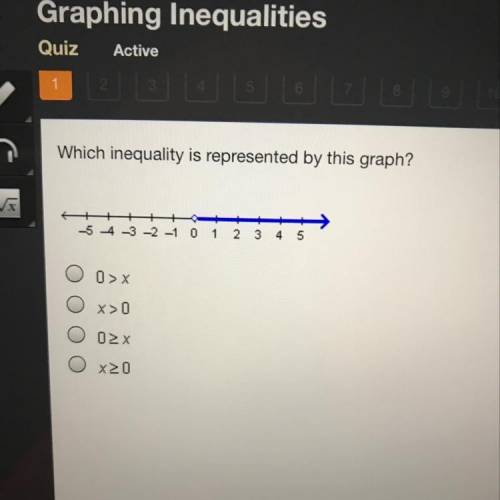
Which inequality is represented by this graph? -5 4 -3 -2 -1 0 1
2
3
4
5
0 > X
O x>0
ΟΣΧ
O x20
Twenty points!! And giving brainliest


Which inequality is represented by this graph?

-5 4 -3 -2 -1 0 1
2
3
4
5
0 > X
O x>0
ΟΣΧ
O

ansver
Answers: 1

Another question on Mathematics

question
Mathematics, 21.06.2019 21:00
What is the value of m in the equation 1/2 m - 3/4n=16 when n=8
Answers: 1
question
Mathematics, 21.06.2019 21:50
Aparticular telephone number is used to receive both voice calls and fax messages. suppose that 25% of the incoming calls involve fax messages, and consider a sample of 25 incoming calls. (a) what is the expected number of calls among the 25 that involve a fax message?
Answers: 1
question
Mathematics, 21.06.2019 22:00
Acaterer charges $500 plus $30 per guest to cater a wedding. walt and traci don't want to spend more than $8000 on catering. write and solve an inequality in terms of the number of guests, g, that can be invited. a) 30g ? 8000; g ? 267 b) 500g < 8000; g < 16 c) 500 + 30g < 8000; g < 250 d) 500 + 30g ? 8000; g ? 250
Answers: 1
question
Mathematics, 22.06.2019 00:30
Find the solution on the interval [0, 2pi)
Answers: 1
You know the right answer?
Which inequality is represented by this graph? -5 4 -3 -2 -1 0 1
2
3
4
5
Questions
Questions on the website: 13722361