
Mathematics, 04.12.2020 23:30 labrandonanderson00
Can you guys please help this is a test and if I fail it I will have to retake my class...? I will mark the correct answer brainlest!!
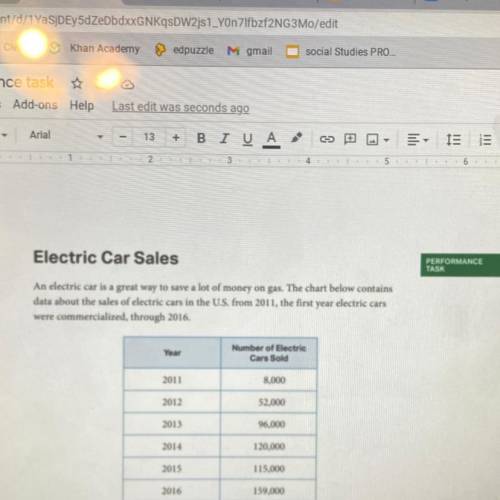
So up in the photo is the chart and here are the questions:
A: construct a scatterplot for the data provided to represent the number of a electric cars sold each year. Be sure to number and label your axis, and explain any choices made in scaling your graph.
B: estimate a good line a fit for this data. What is the meaning of the slope and vertical axis intercept you have estimated in the context of the problem?
C: writers in the automotive magazines have created nicknames for the following years:
2014-15 the year of the slide
2015-16 the year of the comeback
Explain the meanings of these nicknames within the context of the data. Use your graph to explain the general trend in neglect your car sales from 2011 through 2016
D: use your Lennar model from part B to predict in what calendar year the number of a collector cars sold will reach 300,000...

Answers: 1


Another question on Mathematics
Mathematics, 21.06.2019 17:00
The table shows population statistics for the ages of best actor and best supporting actor winners at an awards ceremony. the distributions of the ages are approximately bell-shaped. compare the z-scores for the actors in the following situation. best actor best supporting actor muequals42.0 muequals49.0 sigmaequals7.3 sigmaequals15 in a particular year, the best actor was 59 years old and the best supporting actor was 45 years old. determine the z-scores for each. best actor: z equals best supporting actor: z equals (round to two decimal places as needed.) interpret the z-scores. the best actor was (more than 2 standard deviations above more than 1 standard deviation above less than 1 standard deviation above less than 2 standard deviations below) the mean, which (is not, is) unusual. the best supporting actor was (less than 1 standard deviation below more than 1 standard deviation above more than 2 standard deviations below more than 1 standard deviation below) the mean, which (is is not) unusual.
Answers: 1
Mathematics, 21.06.2019 21:00
List x1, x2, x3, x4 where xi is the midpoint endpoint of the five equal intervals used to estimate the area under the curve of f(x) between x = 0 and x = 10.
Answers: 1
Mathematics, 21.06.2019 22:40
Afunction g(x) has x-intercepts at (, 0) and (6, 0). which could be g(x)? g(x) = 2(x + 1)(x + 6) g(x) = (x – 6)(2x – 1) g(x) = 2(x – 2)(x – 6) g(x) = (x + 6)(x + 2)
Answers: 1
Mathematics, 22.06.2019 01:40
Manuela solved the equation below. what is the solution to manuela’s equation?
Answers: 2
You know the right answer?
Can you guys please help this is a test and if I fail it I will have to retake my class...? I will m...
Questions

History, 26.10.2020 15:20
Mathematics, 26.10.2020 15:20

Computers and Technology, 26.10.2020 15:20


English, 26.10.2020 15:20
Engineering, 26.10.2020 15:20

History, 26.10.2020 15:20
Mathematics, 26.10.2020 15:20
Mathematics, 26.10.2020 15:20
Mathematics, 26.10.2020 15:20

Biology, 26.10.2020 15:20


