
Mathematics, 06.12.2020 05:40 samantha636
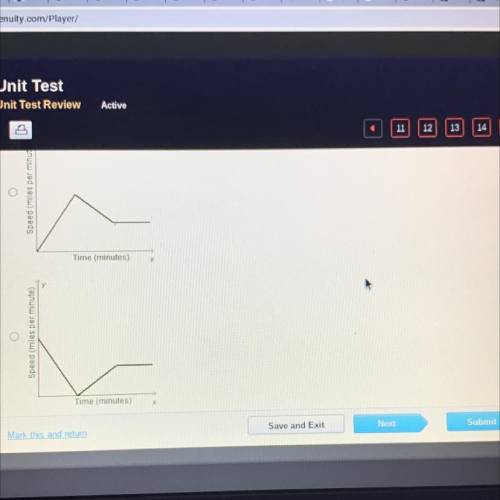
Which graph could represent a car that begins by increasing its speed, then travels at a constant speed, and then
decreases its speed, as time increases?
Speed (miles per minute)
Time (minutes)
х
(miles per minute)

Answers: 1


Another question on Mathematics
Mathematics, 21.06.2019 16:00
12. the amount of money in a bank account decreased by 21.5% over the last year. if the amount of money at the beginning of the year is represented by ‘n', write 3 equivalent expressions to represent the amount of money in the bank account after the decrease?
Answers: 2
Mathematics, 21.06.2019 19:30
Aproduction manager test 10 toothbrushes and finds that their mean lifetime is 450 hours. she then design sales package of this type of toothbrush. it states that the customers can expect the toothbrush to last approximately 460 hours. this is an example of what phase of inferential statistics
Answers: 1
Mathematics, 22.06.2019 00:00
Macy spent $36 on jeans. this was $12 less than twice what she spent on a shirt. which equation to solve this, 12x=36 2x=36-12 2x-12=36 12-2x=36
Answers: 1
Mathematics, 22.06.2019 02:10
Which pair of expressions is equivalent? a 7(1–k)and7–k b 7(1–k)and1–7k c 7(1–k)and7–k d 7(1–k)and7–7k
Answers: 1
You know the right answer?
Which graph could represent a car that begins by increasing its speed, then travels at a constant sp...
Questions

History, 10.10.2019 01:50

Mathematics, 10.10.2019 01:50
Biology, 10.10.2019 01:50

English, 10.10.2019 01:50
English, 10.10.2019 01:50
Mathematics, 10.10.2019 01:50

Social Studies, 10.10.2019 01:50
Mathematics, 10.10.2019 01:50

Business, 10.10.2019 01:50


Geography, 10.10.2019 01:50
Biology, 10.10.2019 01:50


