
Mathematics, 07.12.2020 01:00 madiliann12120
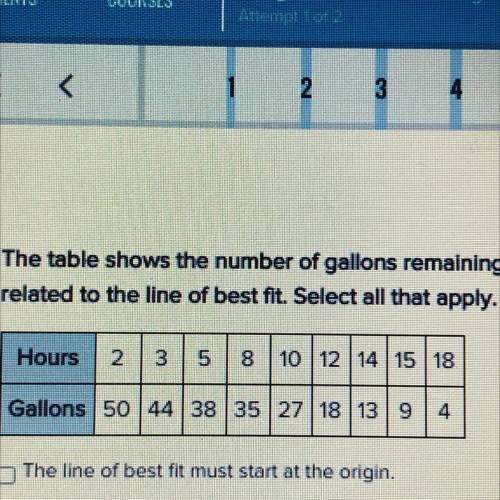
The following table shows the population of a town in thousands. Determine the correct descriptions of the scatter
plot. Select all that apply
1. The last year on the plot is 2014.
2. The ordered pair is written as (year, population).
3. The scatter plot is plotted in the first and fourth quadrants.
4. A reasonable interval for the scale of the horizontal axis would be by one.
5. A reasonable interval for the scale of the vertical axis would be by two-tenths. l

Answers: 2


Another question on Mathematics
Mathematics, 21.06.2019 14:30
Jack is considering a list of features and fees for denver bank. jack plans on using network atms about 4 times per month. what would be jack’s total estimated annual fees for a checking account with direct paycheck deposit, one overdraft per year, and no 2nd copies of statements?
Answers: 3
Mathematics, 21.06.2019 15:30
What is the probability of drawing three queens from a standard deck of cards, given that the first card drawn was a queen? assume that the cards are not replaced.
Answers: 2
Mathematics, 21.06.2019 20:30
Find the value of x for which line a is parallel to line b
Answers: 1
You know the right answer?
The following table shows the population of a town in thousands. Determine the correct descriptions...
Questions


Mathematics, 16.11.2020 19:00
Mathematics, 16.11.2020 19:00

Geography, 16.11.2020 19:00

English, 16.11.2020 19:00
Mathematics, 16.11.2020 19:00
Mathematics, 16.11.2020 19:00
Mathematics, 16.11.2020 19:00

Mathematics, 16.11.2020 19:00


