*SHOW WORK*
Step 1: Describing and analyzing the data
Sixth-grade students completed a r...

Mathematics, 07.12.2020 21:00 pat930
*SHOW WORK*
Step 1: Describing and analyzing the data
Sixth-grade students completed a random survey to determine how many songs each
student has downloaded to his/her media player in the past two months. The data
Girls: 50, 32, 15, 56, 81, 50, 18, 81, 22, 55.
Boys: 75, 41, 25, 22, 7, 0, 43, 12, 45, 70.
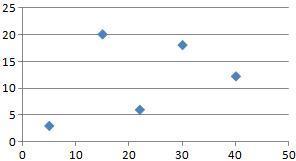
gathered is represented in the table below
a) Compute the measures of center for both the boys and girls data. Describe their
differences. Use the terms mean and median to justify your answer. (3 points)
b) Compute The measures of spread for the data collected for boys and girls. Describe their differences in detail using specific terms of spread. (4 points)
c) is it possible to make a valid conclusions based on the data collected? (2 points)

Answers: 3


Another question on Mathematics

Mathematics, 21.06.2019 17:00
(! ) three cylinders have a height of 8 cm. cylinder 1 has a radius of 1 cm. cylinder 2 has a radius of 2 cm. cylinder 3 has a radius of 3 cm. find the volume of each cylinder
Answers: 1

Mathematics, 21.06.2019 18:00
An appliance store sells lamps at $95.00 for two. a department store sells similar lamps at 5 for $250.00. which store sells at a better rate
Answers: 1

Mathematics, 21.06.2019 21:30
Students are given 3 minutes to complete each multiple-choice question on a test and 8 minutes for each free-responsequestion. there are 15 questions on the test and the students have been given 55 minutes to complete itwhich value could replace x in the table? 5507-m23-m8(15-m)8(15)-m
Answers: 2

You know the right answer?
Questions


Biology, 22.05.2020 13:58


Mathematics, 22.05.2020 13:58


English, 22.05.2020 13:58

Mathematics, 22.05.2020 13:58


Social Studies, 22.05.2020 13:58


English, 22.05.2020 13:58

Mathematics, 22.05.2020 13:58

Mathematics, 22.05.2020 13:58


