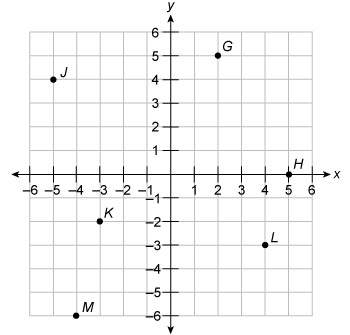
In which quadrant of the coordinate graph does point j lie?
quadrant ii
qua...

Mathematics, 03.11.2019 16:31 ssteitzsophiee223
In which quadrant of the coordinate graph does point j lie?
quadrant ii
quadrant
quadrant
quadrant iv
see file

Answers: 1


Another question on Mathematics
Mathematics, 20.06.2019 18:04
Complete the square to determine the minimum or maximum value of the function defined by the expression. x2 − 12x − 2 a) maximum value at 38 b) minimum value at 38 c) maximum value at −38 d) minimum value at −38
Answers: 3
Mathematics, 21.06.2019 18:30
For this option, you will work individually. the pythagorean theorem can be used in many real-world scenarios. part 1 write your own real-world scenario where the pythagorean theorem can be applied to find a missing piece. you may choose to write a problem that is two- or three-dimensional in nature. be sure that you will be able to draw a diagram of your scenario. write out your problem and submit it for part 1. be sure to end your scenario with a question. part 2 draw a diagram of the scenario you created in part 1. you may draw by hand and scan and upload your drawing or create a computer-generated drawing for submission. be sure to label all parts and dimensions of the drawing. part 3 solve the question that you posed in part 1. show all of your steps in answering the question. for this option, you will need to submit all three parts for full credit—your real-world problem and question, the diagram that you created, and your work solving the problem, showing all steps. * note that your instructor is looking for your own original idea. while it is acceptable to use the internet for research and inspiration, academic integrity policies apply.
Answers: 1
Mathematics, 21.06.2019 18:30
The table shows the relationship between the number of cups of cereal and the number of cups of raisins in a cereal bar recipe: number of cups of cereal number of cups of raisins 8 2 12 3 16 4 molly plotted an equivalent ratio as shown on the grid below: a graph is shown. the title of the graph is cereal bars. the horizontal axis label is cereal in cups. the x-axis values are 0, 20, 40, 60, 80,100. the vertical axis label is raisins in cups. the y-axis values are 0, 10, 20, 30, 40, 50. a point is plotted on the ordered pair 40,20. which of these explains why the point molly plotted is incorrect? (a) if the number of cups of cereal is 40, then the number of cups of raisins will be10. (b)if the number of cups of raisins is 40, then the number of cups of cereal will be10. (c) if the number of cups of cereal is 40, then the number of cups of raisins will be 80. (d) if the number of cups of raisins is 40, then the number of cups of cereal will be 80.
Answers: 1
You know the right answer?
Questions
Mathematics, 22.01.2021 21:10

History, 22.01.2021 21:10

English, 22.01.2021 21:10
Mathematics, 22.01.2021 21:10

Social Studies, 22.01.2021 21:10

Physics, 22.01.2021 21:10
Mathematics, 22.01.2021 21:10

Physics, 22.01.2021 21:10


