Mathematics, 08.12.2020 01:00 amyy49
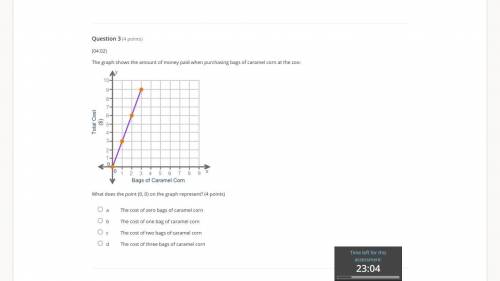
The graph shows the amount of money paid when purchasing bags of caramel corn at the zoo:
A graph is shown. The x-axis is labeled from 0 to 9. The y-axis is labeled from 0 to 10. Four points are shown on the graph on ordered pairs 0, 0 and 1, 3 and 2, 6 and 3, 9. These points are joined by a line. The label on the x-axis is Bags of caramel corn. The title on the y-axis is Total cost in dollars.
What does the point (0, 0) on the graph represent? (4 points)
a
The cost of zero bags of caramel corn
b
The cost of one bag of caramel corn
c
The cost of two bags of caramel corn
d
The cost of three bags of caramel corn


Answers: 2


Another question on Mathematics

Mathematics, 21.06.2019 16:30
Ahome improvement store rents it’s delivery truck for $19 for the first 75 minutes and $4.75 for each additional 1/4 hour. if a customer rented the truck at 11: 10 am and returned the truck at 1: 40 pm the same day, what would his rental cost be?
Answers: 1


Mathematics, 21.06.2019 22:30
Factor the polynomial, if possible. if the polynomial cannot be factored, write prime. 9n^3 + 27n^2 – 25n – 75
Answers: 2

Mathematics, 21.06.2019 23:00
If 3 3/4 lb. of candy costs 20.25 how much would 1lb. of candy cost
Answers: 1
You know the right answer?
The graph shows the amount of money paid when purchasing bags of caramel corn at the zoo:
A graph i...
Questions


Mathematics, 13.11.2020 16:40

Chemistry, 13.11.2020 16:40

Mathematics, 13.11.2020 16:40


Computers and Technology, 13.11.2020 16:40


History, 13.11.2020 16:40


Biology, 13.11.2020 16:40


