A) Create a table and graph representing each person's amount of
money they have saved.
b) Wh...

Mathematics, 08.12.2020 01:10 justinpatengale2002
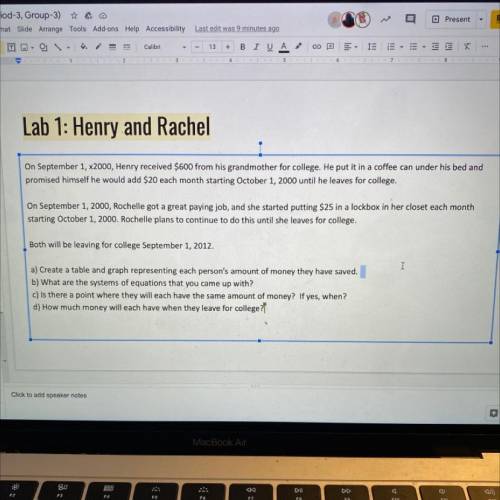
A) Create a table and graph representing each person's amount of
money they have saved.
b) What are the systems of equations that you came up with?
c) Is there a point where they will each have the same amount of
money? If yes, when?
d) How much money will each have when they leave for college?

Answers: 1


Another question on Mathematics
Mathematics, 21.06.2019 23:00
How many 3-digit numbers can you write using only digits 1 and 7? (of course, digits can repeat.) how many 3-digit numbers can you write using only digits 1 and 7? (of course, digits can repeat.)
Answers: 2
Mathematics, 22.06.2019 02:00
Which is the best estimate of the product of 0.9 x 0.88? 0 0.25 0.5 1
Answers: 2
Mathematics, 22.06.2019 02:30
Atrain traveled for 1.5 hours to the first station, stopped for 30 minutes, then traveled for 4 hours to the final station where it stopped for 1 hour. the total distance traveled is a function of time. which graph most accurately represents this scenario? a graph is shown with the x-axis labeled time (in hours) and the y-axis labeled total distance (in miles). the line begins at the origin and moves upward for 1.5 hours. the line then continues upward at a slow rate until 2 hours. from 2 to 6 hours, the line continues quickly upward. from 6 to 7 hours, it moves downward until it touches the x-axis a graph is shown with the axis labeled time (in hours) and the y axis labeled total distance (in miles). a line is shown beginning at the origin. the line moves upward until 1.5 hours, then is a horizontal line until 2 hours. the line moves quickly upward again until 6 hours, and then is horizontal until 7 hours a graph is shown with the axis labeled time (in hours) and the y-axis labeled total distance (in miles). the line begins at the y-axis where y equals 125. it is horizontal until 1.5 hours, then moves downward until 2 hours where it touches the x-axis. the line moves upward until 6 hours and then moves downward until 7 hours where it touches the x-axis a graph is shown with the axis labeled time (in hours) and the y-axis labeled total distance (in miles). the line begins at y equals 125 and is horizontal for 1.5 hours. the line moves downward until 2 hours, then back up until 5.5 hours. the line is horizontal from 5.5 to 7 hours
Answers: 1
You know the right answer?
Questions

Social Studies, 14.10.2020 23:01
Mathematics, 14.10.2020 23:01
Mathematics, 14.10.2020 23:01

Geography, 14.10.2020 23:01

English, 14.10.2020 23:01

Mathematics, 14.10.2020 23:01
Biology, 14.10.2020 23:01


Social Studies, 14.10.2020 23:01

Mathematics, 14.10.2020 23:01
History, 14.10.2020 23:01


