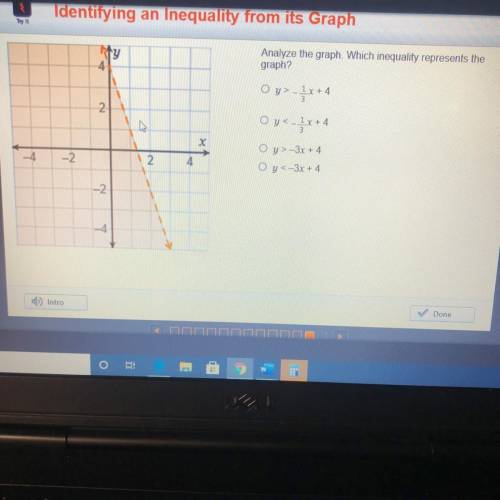
Analyze the graph Which inequality represents the
graph?
4
O y> -
2
Oy<- 1x...

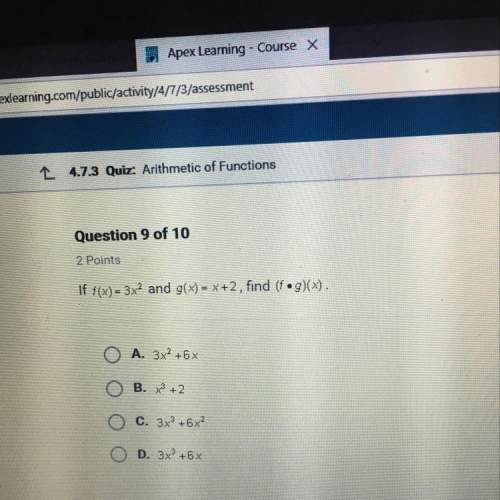
Mathematics, 08.12.2020 01:30 101EXPERIENCE
Analyze the graph Which inequality represents the
graph?
4
O y> -
2
Oy<- 1x + 4
3
x
Oy> -3x + 4
Oy<-3x + 4
-4
-2
2.
4
-2
-4

Answers: 1


Another question on Mathematics
Mathematics, 21.06.2019 19:30
Which statements are true? check all that apply. the line x = 0 is perpendicular to the line y = –3. all lines that are parallel to the y-axis are vertical lines. all lines that are perpendicular to the x-axis have a slope of 0. the equation of the line parallel to the x-axis that passes through the point (2, –6) is x = 2. the equation of the line perpendicular to the y-axis that passes through the point (–5, 1) is y = 1.
Answers: 1
Mathematics, 22.06.2019 00:30
What is the mean of the data set 125, 141, 213, 155, 281
Answers: 2
You know the right answer?
Questions

English, 04.05.2021 04:30
Mathematics, 04.05.2021 04:30
Mathematics, 04.05.2021 04:30
English, 04.05.2021 04:30

Physics, 04.05.2021 04:30

Biology, 04.05.2021 04:30
Mathematics, 04.05.2021 04:30
Mathematics, 04.05.2021 04:30
English, 04.05.2021 04:30

Mathematics, 04.05.2021 04:30
English, 04.05.2021 04:30

Chemistry, 04.05.2021 04:30


