1
Which graph shows a line of best fit for the scatter plot?
A
Time Watching TV vs. Gra...

Mathematics, 08.12.2020 02:30 goofy44
1
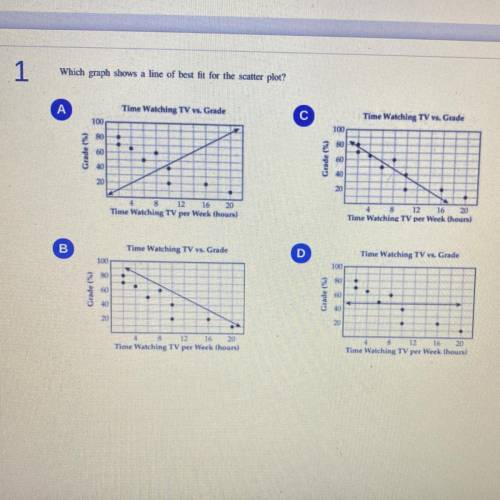
Which graph shows a line of best fit for the scatter plot?
A
Time Watching TV vs. Grade
с
Time Watching TV w. Grade
100
100
80
280
Grade ()
60
Grade (4)
60
40
40
20
20
12
4 8 12 16 20
Time Watching TV per week thours)
16 20
Time Watching TV per week hours)
B
Time Watching TV vs. Grade
D
Time Watching TV vs. Grade
100
100
Grade (6)
60
20
4
12 16 20
Time Watching TV per Week hours)
+
12 16 20
Time Watching TV per week thours)

Answers: 3


Another question on Mathematics
Mathematics, 21.06.2019 15:00
"princess tower" in dubai is considered the world's tallest residential building, towering to 1 0 1 101 floors! t ( n ) t(n) models the number of tenants living on floor n n of the tower. what does the statement t ( 2 0 ) = t ( c ) t(20)=t(c) mean?
Answers: 2
Mathematics, 21.06.2019 22:00
What is the solution to the division problem below x3+x2-11x+4/x+4
Answers: 2
Mathematics, 21.06.2019 22:30
What is the common difference for this arithmetic sequence? -6,-2,2,6,10 a.4 b.5 c.3 d.6
Answers: 1
You know the right answer?
Questions


History, 03.03.2021 03:20


Social Studies, 03.03.2021 03:20
Mathematics, 03.03.2021 03:20
Mathematics, 03.03.2021 03:20
English, 03.03.2021 03:20

Advanced Placement (AP), 03.03.2021 03:20
Social Studies, 03.03.2021 03:20
Mathematics, 03.03.2021 03:20
English, 03.03.2021 03:20


