
Mathematics, 08.12.2020 02:30 taylortayshaun7
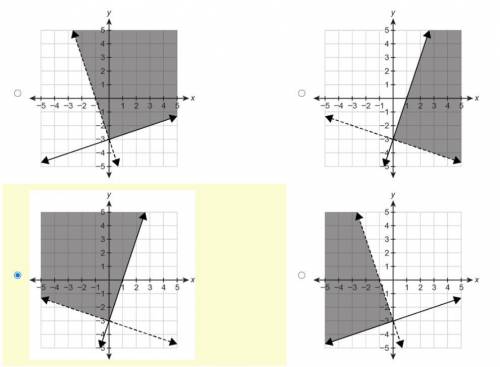
Which graph represents the solution set of the system of inequalities?
{3y≥x−93x+y>−3
please only comment if you dont know, its kinda annoying how much people just use an actaul answer slot to put the fact they dont know, it will be reported
A system of 2 linear inequalities graphed on a coordinate plane. The horizontal x axis ranges from negative 5 to 5 in increments of 1. The vertical y axis ranges from negative 5 to 5 in increments of 1. A dashed line passes through begin ordered pair 0 comma negative 3 end ordered pair and begin ordered pair negative 2 comma 3 end ordered pair. A solid line passes through begin ordered pair 0 comma negative 3 end ordered pair and begin ordered pair negative 3 comma negative 4 end ordered pair. The region above the dashed line and above the solid line is shaded.
A system of 2 linear inequalities graphed on a coordinate plane. The horizontal x axis ranges from negative 5 to 5 in increments of 1. The vertical y axis ranges from negative 5 to 5 in increments of 1. A dashed line passes through begin ordered pair 0 comma negative 3 end ordered pair and begin ordered pair negative 3 comma negative 2 end ordered pair. A solid line passes through begin ordered pair 0 comma negative 3 end ordered pair and begin ordered pair 2 comma 3 end ordered pair. The region above the dashed line and below the solid line is shaded.
A system of 2 linear inequalities graphed on a coordinate plane. The horizontal x axis ranges from negative 5 to 5 in increments of 1. The vertical y axis ranges from negative 5 to 5 in increments of 1. A dashed line passes through begin ordered pair 0 comma negative 3 end ordered pair and begin ordered pair 3 comma negative 4 end ordered pair. A solid line passes through begin ordered pair 0 comma negative 3 end ordered pair and begin ordered pair 2 comma 3 end ordered pair. The region above the dashed line and above the solid line is shaded.
A system of 2 linear inequalities graphed on a coordinate plane. The horizontal x axis ranges from negative 5 to 5 in increments of 1. The vertical y axis ranges from negative 5 to 5 in increments of 1. A dashed line passes through begin ordered pair 0 comma negative 3 end ordered pair and begin ordered pair negative 2 comma 3 end ordered pair. A solid line passes through begin ordered pair 0 comma negative 3 end ordered pair and begin ordered pair 3 comma negative 2 end ordered pair. The region below the dashed line and above the solid line is shaded.

Answers: 3


Another question on Mathematics
Mathematics, 21.06.2019 21:00
List x1, x2, x3, x4 where xi is the midpoint endpoint of the five equal intervals used to estimate the area under the curve of f(x) between x = 0 and x = 10.
Answers: 1
Mathematics, 21.06.2019 22:30
At the beginning of year 1, carlos invests $600 at an annual compound interest rate of 4%. he makes no deposits to or withdrawals from the account. which explicit formula can be used to find the account's balance at the beginning of year 5? what is, the balance?
Answers: 1
Mathematics, 22.06.2019 02:30
You are living in aldine, tx and you are planning a trip to six flags in arlington, tx. you look on a map that has a scale of 0.5 inches to 30 miles. if the map shows the scale distance from aldine to arlington is 4 inches, how far is the actual distance?
Answers: 1
Mathematics, 22.06.2019 02:40
An oil exploration company currently has two active projects, one in asia and the other in europe. let a be the event that the asian project is successful and b be the event that the european project is successful. suppose that a and b are independent events with p(a) = 0.2 and p(b) = 0.8. (a) if the asian project is not successful, what is the probability that the european project is also not successful? (b) what is the probability that at least one of the two projects will be successful? (c) given that at least one of the two projects is successful, what is the probability that only the asian project is successful? (round your answer to three decimal places.)
Answers: 3
You know the right answer?
Which graph represents the solution set of the system of inequalities?
{3y≥x−93x+y>−3
Questions


English, 31.03.2020 17:32

Physics, 31.03.2020 17:32
Mathematics, 31.03.2020 17:32
Biology, 31.03.2020 17:32
Mathematics, 31.03.2020 17:32
Mathematics, 31.03.2020 17:32

Mathematics, 31.03.2020 17:32

Health, 31.03.2020 17:32
Mathematics, 31.03.2020 17:32


