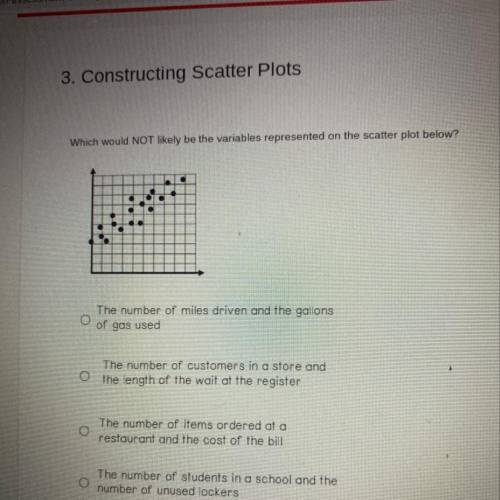
Which would NOT likely be the variables represented on the scatter plot below?
...

Mathematics, 08.12.2020 08:00 kelseydavid69
Which would NOT likely be the variables represented on the scatter plot below?

Answers: 3


Another question on Mathematics
Mathematics, 21.06.2019 17:00
Amanager recorded the number of bicycles sold by his company each quarter. his projected sales after t years is given by the expression below. which of the following statements best describes the expression? a. the initial sales of 575 bicycles increases at the rate of 4% over 4 quarters. b. the initial sales of 575 bicycles increases at the rate of 18% over 4 years. c. the initial sales of 575 bicycles increases at the rate of 4% over t quarters. d. the initial sales of 575 bicycles increases at the rate of 18% over t years.
Answers: 1
Mathematics, 21.06.2019 17:50
The length and width of a rectangle are consecutive even integers the area of the rectangle is 120 squares units what are the length and width of the rectangle
Answers: 1
Mathematics, 21.06.2019 19:50
A3-dimensional figure has a square base and 4 lateral faces that meet at a point. explain the difference between the cross sections when a slice is made perpendicular to the base through the vertex, and when a slice is made perpendicular to the base and not through the vertex
Answers: 2
Mathematics, 21.06.2019 20:30
Asunflower was 20 1/2 inches tall. over the next 6 months, it grew to a height of 37 inches tall. what was the average yearly growth rate of the height of the plzzz write a proportion i will give you 100 points
Answers: 1
You know the right answer?
Questions
Mathematics, 12.08.2020 04:01


Mathematics, 12.08.2020 04:01


Geography, 12.08.2020 04:01
Mathematics, 12.08.2020 04:01


