53. The graph of a linear function is shown on the grid.
y
x
4 5 6 7 8 9
-4
...

Mathematics, 08.12.2020 20:20 christianmason9423
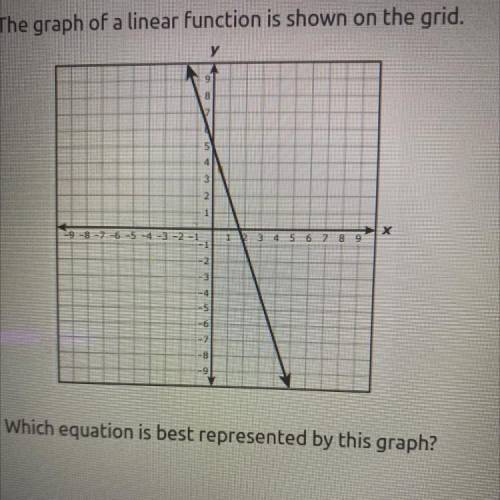
53. The graph of a linear function is shown on the grid.
y
x
4 5 6 7 8 9
-4
5
Which equation is best represented by this graph?

Answers: 1


Another question on Mathematics
Mathematics, 21.06.2019 18:00
What does the relationship between the mean and median reveal about the shape of the data
Answers: 1
Mathematics, 21.06.2019 20:30
Tom is the deli manager at a grocery store. he needs to schedule employee to staff the deli department for no more that 260 person-hours per week. tom has one part-time employee who works 20 person-hours per week. each full-time employee works 40 person-hours per week. write and inequality to determine n, the number of full-time employees tom may schedule, so that his employees work on more than 260 person-hours per week. graph the solution set to this inequality.
Answers: 1
Mathematics, 21.06.2019 22:30
Ingredient c: 1/4 cup for 2/3 serving or ingredient d: 1/3 cup for 3/4 serving which unit rate is smaller
Answers: 2
Mathematics, 22.06.2019 01:30
Find the vertex for the parabola given by the function ƒ(x) = −3x2 − 6x.
Answers: 2
You know the right answer?
Questions

Biology, 21.05.2020 23:13
Mathematics, 21.05.2020 23:13

History, 21.05.2020 23:13
Mathematics, 21.05.2020 23:13

English, 21.05.2020 23:13
Mathematics, 21.05.2020 23:13
Mathematics, 21.05.2020 23:13
History, 21.05.2020 23:13


