Mathematics, 08.12.2020 21:40 weeblordd
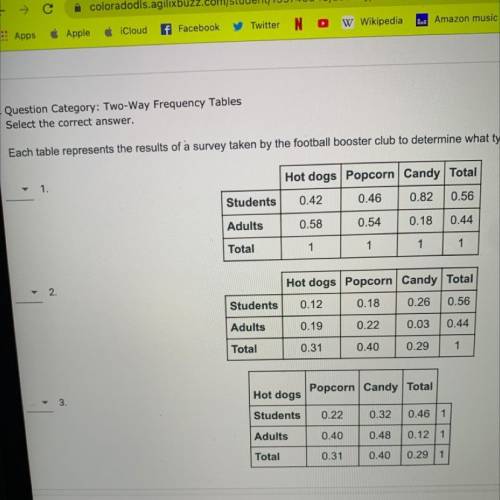
Each table represents the results of a survey taken by the football booster club to determine what types of concessions they should offer at football games. Determine which relative frequency table would be the best choice to find each piece of information.
a.
the percentage of people surveyed who are adults and prefer hot dogs
b.
the percentage of people with a preference for candy who are students
c.
the percentage of students who prefer popcorn


Answers: 2


Another question on Mathematics

Mathematics, 21.06.2019 16:00
The classrooms are trying to raise $1,200.00 for charity. mrs. leblanc's class has raised 50%. mr. patel's class has raised $235.14 ms. warner's class has raised 1/3 as much as mrs. leblanc's class. how much more money is needed to reach the goal of $1,200.00?
Answers: 1

Mathematics, 21.06.2019 18:00
Factor x2 – 8x + 15. which pair of numbers has a product of ac and a sum of what is the factored form of the
Answers: 1

Mathematics, 21.06.2019 19:10
The linear combination method is applied to a system of equations as shown. 4(.25x + .5y = 3.75) → x + 2y = 15 (4x – 8y = 12) → x – 2y = 3 2x = 18 what is the solution of the system of equations? (1,2) (3,9) (5,5) (9,3)
Answers: 1

Mathematics, 21.06.2019 20:00
Solve for x and y a x= 13.3 y= 16.7 b x= 23.3 y= 12.5 c x= 7.5 y= 16.7 d x=7.5 y= 12.5
Answers: 1
You know the right answer?
Each table represents the results of a survey taken by the football booster club to determine what t...
Questions


Biology, 12.01.2020 10:31


History, 12.01.2020 10:31

Social Studies, 12.01.2020 10:31


History, 12.01.2020 10:31

History, 12.01.2020 10:31


Mathematics, 12.01.2020 10:31

Mathematics, 12.01.2020 10:31

Mathematics, 12.01.2020 10:31


