
Mathematics, 09.12.2020 17:50 toledanomariap43bxm
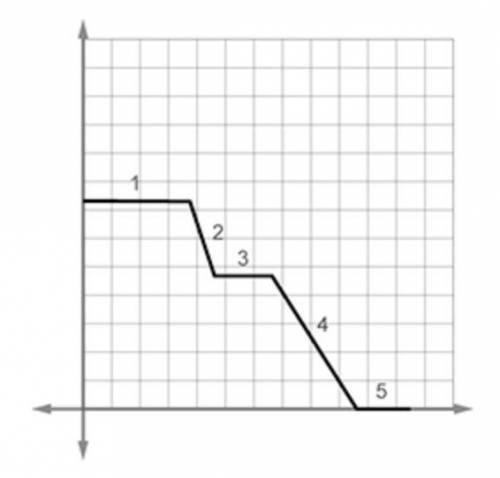
Arthur sits in the park reading a newspaper, then starts walking home at a constant pace. He stops for bagels, then walks the rest of the way home.
1. What does the x-axis represent in this situation?
2. What does the y-axis represent?
3. During which parts of the graph does Arthur's distance from home decrease?
4.When is Arthur waiting for bagels? Explain how you know.
5. If Arthur's pace had not been constant after leaving the bagel shop, which part of the graph would change? Explain how that part of the graph would change.
6. If Arthur had spent less time reading his newspaper, which part of the graph would change? How would that part change?

Answers: 1


Another question on Mathematics
Mathematics, 21.06.2019 14:30
Paint color preference children adults total 0.6 0.77 liked new paint color disliked new paint color 0.4 0.15 0.23 total 1.0 1.0 1.0 which value for x completes the conditional relative frequency table by column?
Answers: 2
Mathematics, 21.06.2019 15:30
Neveah and clint are baking muffins for the bake sale. they need to bake 30 muffins for their display case. clint has baked 4 so far, and neveah has baked 7. how many muffins (m) do they have left to bake? show your work!
Answers: 1
Mathematics, 21.06.2019 16:30
You drop a rubber ball off the roof of a 50 meter high building onto a paved parking lot. it bounces back up with every bounce, but not quite all the way back up to you. after the first bounce it bounces back only 80 percent of the distance it was dropped from. the pattern continues, meaning after every bounce it comes up to just 80 percent of the previous maximum height. so if before the first bounce the height is 50 meters, what height does the ball reach after the fifth bounce? round your answer to one decimal place and chose the correct response from the choices below:
Answers: 1
Mathematics, 21.06.2019 17:00
In tossing one coin 10 times, what are your chances for tossing a head? a tail? 2. in tossing one coin 100 times, what are your chances for tossing a head? a tail? 3. in tossing one coin 200 times, what are your chances for tossing a head? a tail? deviation = ((absolute value of the difference between expected heads and observed heads) + (absolute value of the difference between expected tails and observed tails)) divided by total number of tosses. this value should always be positive. 4. what is the deviation for 10 tosses? 5. what is the deviation for the 100 tosses? 6. what is the deviation for 200 tosses? 7. how does increasing the total number of coin tosses from 10 to 100 affect the deviation? 8. how does increasing the total number of tosses from 100 to 200 affect the deviation? 9. what two important probability principles were established in this exercise? 10. the percent of occurrence is the obtained results divided by the total tosses and multiplied by 100%. toss the coins 100 times and record your results. calculate the percent occurrence for each combination. percent head-head occurrence: percent tail-tail occurrence: percent head-tail occurrence:
Answers: 3
You know the right answer?
Arthur sits in the park reading a newspaper, then starts walking home at a constant pace. He stops f...
Questions
Mathematics, 01.09.2020 23:01

Physics, 01.09.2020 23:01

Social Studies, 01.09.2020 23:01

Mathematics, 01.09.2020 23:01

History, 01.09.2020 23:01

Medicine, 01.09.2020 23:01
English, 01.09.2020 23:01
Mathematics, 01.09.2020 23:01
English, 01.09.2020 23:01
Social Studies, 01.09.2020 23:01


