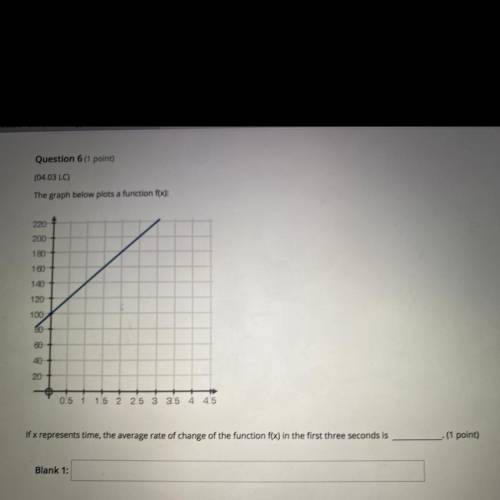
The graph below plots a function f(x):
2204
200
180
160
140
120 +
100
40
60
40
20
0.5 1
1.5 2 2.5 3 3.5 4 4.5
If x represents time, the average rate of change of the function f(x) in the first three seconds is
(1 point)
Blank 1:
No commitments. Cancel anytime. All pricing is in US dollars (USD). The subscriptoin renews automaticaly until you cancel. For more information read our Terms of use & Privacy Policy