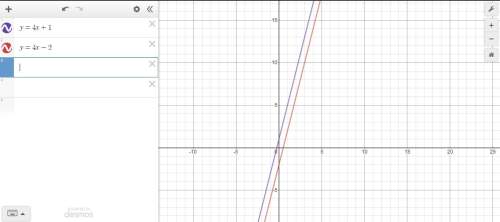
Please help me :)
I'll give to the first person who gets it right its only fair :)
and please...

Mathematics, 09.12.2020 20:20 mmsomefood85
Please help me :)
I'll give to the first person who gets it right its only fair :)
and please don't just answer to get points i really need help


Answers: 3


Another question on Mathematics

Mathematics, 21.06.2019 20:00
Solve each equation using the quadratic formula. find the exact solutions. 6n^2 + 4n - 11
Answers: 2

Mathematics, 21.06.2019 21:30
Write 5(6x+4)-2(5x-2) in the form a(bx+c) where a,b and c integers and a> 1
Answers: 2

Mathematics, 22.06.2019 02:00
Part a what is the area of triangle i? show your calculation. part b triangles i and ii are congruent (of the same size and shape). what is the total area of triangles i and ii? show your calculation. part c what is the area of rectangle i? show your calculation. part d what is the area of rectangle ii? show your calculation. part e rectangles i and iii have the same size and shape. what is the total area of rectangles i and iii? show your calculation. part f what is the total area of all the rectangles? show your calculation. part g what areas do you need to know to find the surface area of the prism? part h what is the surface area of the prism? show your calculation. part i read this statement: “if you multiply the area of one rectangle in the figure by 3, you’ll get the total area of the rectangles.” is this statement true or false? why? part j read this statement: “if you multiply the area of one triangle in the figure by 2, you’ll get the total area of the triangles.” is this statement true or false? why?
Answers: 1

Mathematics, 22.06.2019 02:30
Atrain traveled for 1.5 hours to the first station, stopped for 30 minutes, then traveled for 4 hours to the final station where it stopped for 1 hour. the total distance traveled is a function of time. which graph most accurately represents this scenario? a graph is shown with the x-axis labeled time (in hours) and the y-axis labeled total distance (in miles). the line begins at the origin and moves upward for 1.5 hours. the line then continues upward at a slow rate until 2 hours. from 2 to 6 hours, the line continues quickly upward. from 6 to 7 hours, it moves downward until it touches the x-axis a graph is shown with the axis labeled time (in hours) and the y axis labeled total distance (in miles). a line is shown beginning at the origin. the line moves upward until 1.5 hours, then is a horizontal line until 2 hours. the line moves quickly upward again until 6 hours, and then is horizontal until 7 hours a graph is shown with the axis labeled time (in hours) and the y-axis labeled total distance (in miles). the line begins at the y-axis where y equals 125. it is horizontal until 1.5 hours, then moves downward until 2 hours where it touches the x-axis. the line moves upward until 6 hours and then moves downward until 7 hours where it touches the x-axis a graph is shown with the axis labeled time (in hours) and the y-axis labeled total distance (in miles). the line begins at y equals 125 and is horizontal for 1.5 hours. the line moves downward until 2 hours, then back up until 5.5 hours. the line is horizontal from 5.5 to 7 hours
Answers: 1
You know the right answer?
Questions


Mathematics, 18.03.2021 01:50


History, 18.03.2021 01:50


History, 18.03.2021 01:50

Mathematics, 18.03.2021 01:50


Mathematics, 18.03.2021 01:50

Mathematics, 18.03.2021 01:50


