
Mathematics, 10.12.2020 01:30 awesomegrill
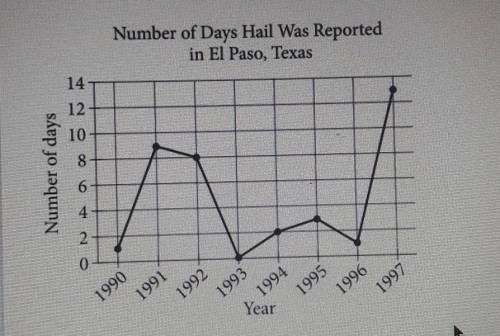
The line graph shows the number of days hail was reported in El Paso, Texas, each year from 1990 to 1997. According to the graph, on how many more days was hail reported in 1992 than in 1995?
A. 1
B. 3
C. 5
D. 8

Answers: 3


Another question on Mathematics
Mathematics, 21.06.2019 16:30
11. minitab software was used to find the lsrl for a study between x=age and y=days after arthroscopic shoulder surgery until an athlete could return to their sport. use the output to determine the prediction model and correlation between these two variables. predictor coef se coef t p constant -5.054 4.355 -1.16 0.279 age 0.2715 0.1427 1.9 0.094 r-sq = 31.16%
Answers: 2
Mathematics, 21.06.2019 17:00
Write numerical coefficient of y² in the expression 2x² - 15xy – 7y²
Answers: 1
Mathematics, 21.06.2019 17:30
Danielle earns a 7.25% commission on everything she sells at the electronics store where she works. she also earns a base salary of $750 per week. what were her sales last week if her total earnings for the week were $1,076.25?
Answers: 3
You know the right answer?
The line graph shows the number of days hail was reported in El Paso, Texas, each year from 1990 to...
Questions


Spanish, 12.02.2021 07:30


Mathematics, 12.02.2021 07:30

Physics, 12.02.2021 07:30
History, 12.02.2021 07:30
Mathematics, 12.02.2021 07:30


Biology, 12.02.2021 07:30
History, 12.02.2021 07:30

Chemistry, 12.02.2021 07:30


