
Mathematics, 10.12.2020 03:40 coreen9
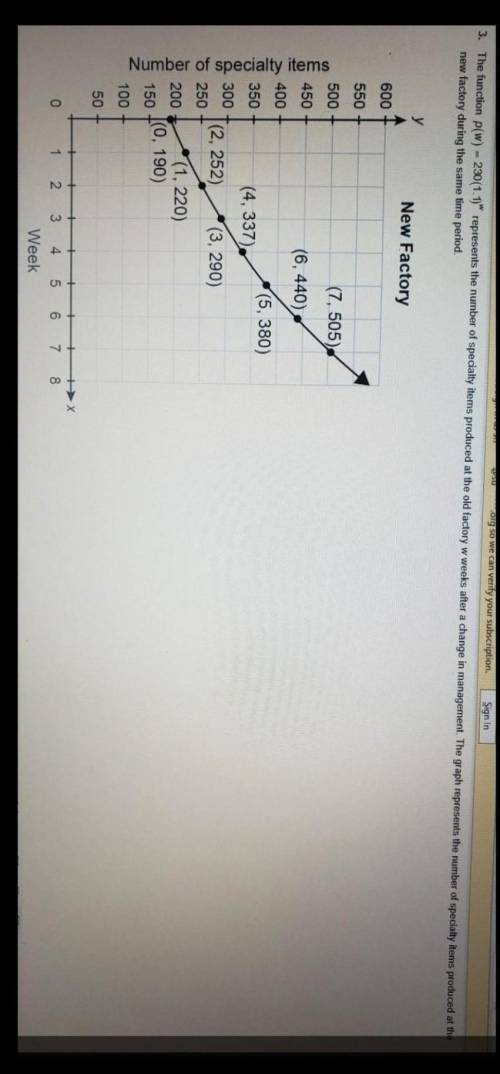
The function p(w) = 230(1.1)^w represents the number of specialty items produced at the old factory w weeks after a change in management. The graph represents the number of specalty items produced at the new factory during the same time period. ( Answer A, B,C Explain and Show you work): A) During Week O, how many more specialty items were produced at tbe old factory than at the new factory? Explain. B) Find and compare the growth rates in the weekly number of specialty items produced at each factory. Show your work. C) When does the weekly number of specialty items produced at the new factory exceed the weekly number of specialty items produced at the old factory? Explain. [ Look at the picture for the graph]. Will Mark Brainliest.

Answers: 1


Another question on Mathematics
Mathematics, 21.06.2019 19:30
The pyramid below was dissected by a horizontal plane which shape describes the pyramid horizontal cross section
Answers: 1
Mathematics, 21.06.2019 22:10
Which function can be used to model the monthly profit for x trinkets produced? f(x) = –4(x – 50)(x – 250) f(x) = (x – 50)(x – 250) f(x) = 28(x + 50)(x + 250) f(x) = (x + 50)(x + 250)
Answers: 2
You know the right answer?
The function p(w) = 230(1.1)^w represents the number of specialty items produced at the old factory...
Questions


Social Studies, 25.06.2019 05:00
Biology, 25.06.2019 05:00

English, 25.06.2019 05:00


