
Mathematics, 10.12.2020 14:00 anitadefrances
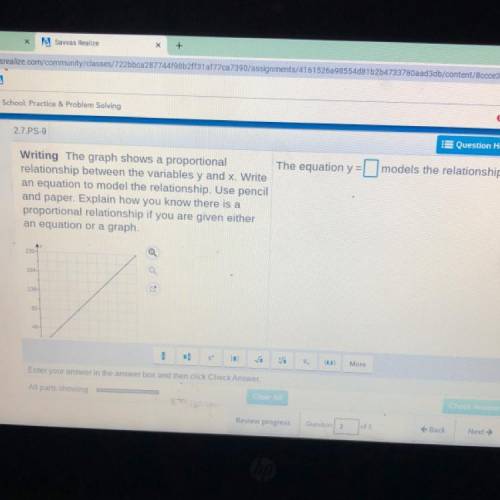
Writing The graph shows a proportional The equation y=models the relationship.
relationship between the variables y and x. Write
an equation to model the relationship. Use pencil
and paper. Explain how you know there is a
proportional relationship if you are given either
an equation or a graph.
A
230-
a
1840
138
92
46
.
(0,0)
More

Answers: 1


Another question on Mathematics
Mathematics, 21.06.2019 17:00
Given that ot =5, xt=12, and ox= 13 is xy tangent to circle o at t? explain.
Answers: 1
Mathematics, 22.06.2019 01:00
How would you find the height of points on the circle? the topic is trigonometry.
Answers: 3
Mathematics, 22.06.2019 02:00
Asix-sided die of unknown bias is rolled 20 times, and the number 3 comes up 6 times. in the next three rounds (the die is rolled 20 times in each round), the number 3 comes up 6 times, 5 times, and 7 times. the experimental probability of rolling a 3 is 10 %, which is approximately % more than its theoretical probability. (round off your answers to the nearest integer.)
Answers: 1
You know the right answer?
Writing The graph shows a proportional The equation y=models the relationship.
relationship between...
Questions

Mathematics, 20.02.2021 21:40


Geography, 20.02.2021 21:40
English, 20.02.2021 21:40

Computers and Technology, 20.02.2021 21:40
Mathematics, 20.02.2021 21:40
Geography, 20.02.2021 21:40
Mathematics, 20.02.2021 21:40
Mathematics, 20.02.2021 21:40


