What is the interquartile range (1QR) of the data set represented by this box
plot?
38
...

Mathematics, 10.12.2020 18:10 allicat8735
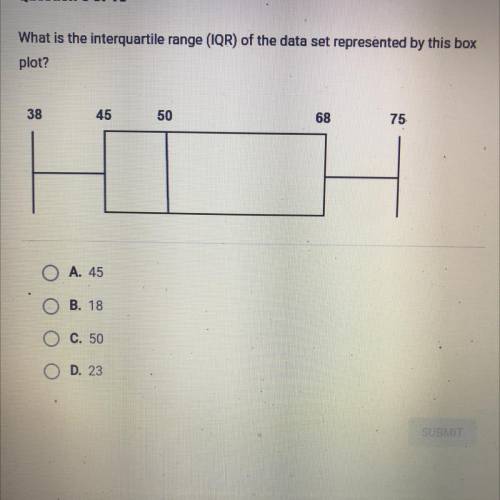
What is the interquartile range (1QR) of the data set represented by this box
plot?
38
45
50
68
75
O A. 45
O B. 18
O C. 50
O D. 23

Answers: 3


Another question on Mathematics
Mathematics, 21.06.2019 15:10
The highest point on earth is the peak of mount everest if you climb to the top you would be approximately 29,035 feet above sea level at remembering that amount is 5280 feet percentage of the height of the mountain would you have to climb to reach a point 2 miles above sea level
Answers: 2
Mathematics, 21.06.2019 18:00
Does anyone know how to do geometryme with this problem
Answers: 1
You know the right answer?
Questions

Chemistry, 11.05.2021 22:20
Mathematics, 11.05.2021 22:20
Mathematics, 11.05.2021 22:20

Geography, 11.05.2021 22:20
Mathematics, 11.05.2021 22:20

Social Studies, 11.05.2021 22:20
Mathematics, 11.05.2021 22:20

Arts, 11.05.2021 22:20


Mathematics, 11.05.2021 22:20


English, 11.05.2021 22:20
History, 11.05.2021 22:20
Mathematics, 11.05.2021 22:20


