Mathematics, 11.12.2020 01:00 24chrim
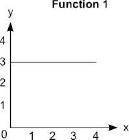
The graph represents function 1 and the equation represents function 2:
A graph with numbers 0 to 4 on the x-axis and y-axis at increments of 1. A horizontal straight line is drawn joining the ordered pairs 0, 3 and 4, 3.
Function 2
y = 3x + 1
How much more is the rate of change of function 2 than the rate of change of function 1?
1
2
3
4


Answers: 1


Another question on Mathematics

Mathematics, 21.06.2019 16:00
Mr and mrs smith buy tickets for themselves and their four children. the cost of an adult ticket is ? 6 more than the adult ticket. the total cost of the six tickets is ? 40.50 work out the cost of an adult ticket. in your working let c be the cost of the child ticket and a be the cost of the adult ticket.
Answers: 1

Mathematics, 21.06.2019 18:40
The ratios 3: 9, 4: 12, 5: 15, and 6: 18 are a pattern of equivalent ratios in the ratio table. which is another ratio in this pattern?
Answers: 1


Mathematics, 21.06.2019 22:00
Determine the domain and range of the given function. the domain is all real numbers all real numbers greater than or equal to –2{x: x = –2, –1, 0, 1, 2}{y: y = –2, –1, 0, 1, 2}. the range is all real numbers all real numbers greater than or equal to –2{x: x = –2, –1, 0, 1, 2}{y: y = –2, –1, 0, 1, 2}.
Answers: 1
You know the right answer?
The graph represents function 1 and the equation represents function 2:
A graph with numbers 0 to 4...
Questions


Mathematics, 20.07.2019 06:00


English, 20.07.2019 06:00


Advanced Placement (AP), 20.07.2019 06:00

Mathematics, 20.07.2019 06:00

Mathematics, 20.07.2019 06:00


Biology, 20.07.2019 06:00

Mathematics, 20.07.2019 06:00

Mathematics, 20.07.2019 06:00

History, 20.07.2019 06:00


